At the onset of the pandemic, the MBTA lost a vast majority of its ridership (and therefore a large portion of its revenue) yet played a critical role in transporting the essential workers that kept the Boston area running. We’ve talked about some general patterns in COVID-era MBTA ridership on the data blog previously (see 2020 ridership in review posts). This post discusses results of a regression analysis of bus and rapid transit ridership and what it can tell us about who was riding the system as well as the benefits and drawbacks of some publicly available data sources. For more detail, a longer report detailing the results of these analyses is available here.
In general, the MBTA lost a greater proportion of riders on rapid transit and the commuter rail than on bus services. However, there is significant variation between individual bus routes as well as between rapid transit lines. By analyzing similar variables for both rapid transit and bus, we can gain more insight into what drove ridership retention (or lack thereof) during the pandemic.
Changes in ridership were analyzed for two different periods: February to April 2020 (the time period with the lowest MBTA ridership) and February to October 2020 (which had the highest ridership during the pandemic). To measure bus ridership, Automatic Passenger Counter (APC) boardings on weekdays were averaged for each stop and then summed to the census tract level. Routes that ran run as directed (RAD) buses may have had some missing data during the height of the pandemic. Rapid transit ridership was measured by average weekday validations at gated stations. Half-mile catchment areas around stations were used to aggregate information about jobs and population for each station.
Two different sources of demographic information were used — the 2019 American Community Survey (which collects information on residential demographics) and the 2015-2017 MBTA Systemwide Passenger Survey. In general, the riders of the MBTA tend to vary from the residents in areas surrounding stations. This analysis confirmed that fact — for February to October ridership, better model fit was observed when using the demographics from the MBTA Passenger survey (even though the data are now several years old). Interestingly, when looking at February to April ridership retention, we saw better fit on the models using ACS data. In April, with many destinations closed and, in general, much fewer trips being made, people were more likely to make home-based trips than during non-pandemic times. This fact may have contributed to better model fit in the analysis of April ridership.
The variable with the strongest relationship to rider retention across time periods, modes, and data sources was an index aimed at capturing the percentage of riders (or residents) in a given area that are low-income, people of color, or have limited access to a vehicle. Similar to the process used for Forging Ahead, this index is an attempt to capture “transit criticality.” Throughout the pandemic, at least on bus and rapid transit, routes and station catchment areas with higher proportions of people of color, low-income residents/riders, and people with limited vehicle access had greater ridership retention. For example, for April 2020, the following model results indicate a very strong positive (i.e., a higher index value indicates higher ridership/less ridership decline) relationship between the transit criticality index and ridership change at gated stations.
| Term | Estimate | Standard Error | t-statistic | P-value |
| (Intercept) | -0.99174 | 0.019248 | -51.524 | 0 |
| Population | -1.06E-06 | 9.42E-07 | -1.127 | 0.265 |
| Number of Jobs | -3.16E-07 | 1.47E-07 | -2.158 | 0.035 |
| Number of Medical Jobs | 1.64E-06 | 7.67E-07 | 2.142 | 0.037 |
| Number of Educational Jobs | -4.48E-06 | 1.40E-06 | -3.213 | 0.002 |
| Number of Retail Jobs | 3.00E-08 | 3.04E-06 | 0.01 | 0.992 |
| Number of Bus Routes in 1/4 Mile | 0.002973 | 0.001067 | 2.786 | 0.007 |
| CR Station within 1/1 mi | -0.01761 | 0.01182 | -1.49 | 0.142 |
| Transit Criticality Index | 0.078516 | 0.015527 | 5.057 | 0 |
Observations: 62, R2 = 0.550, Adj. R2 = 0.482
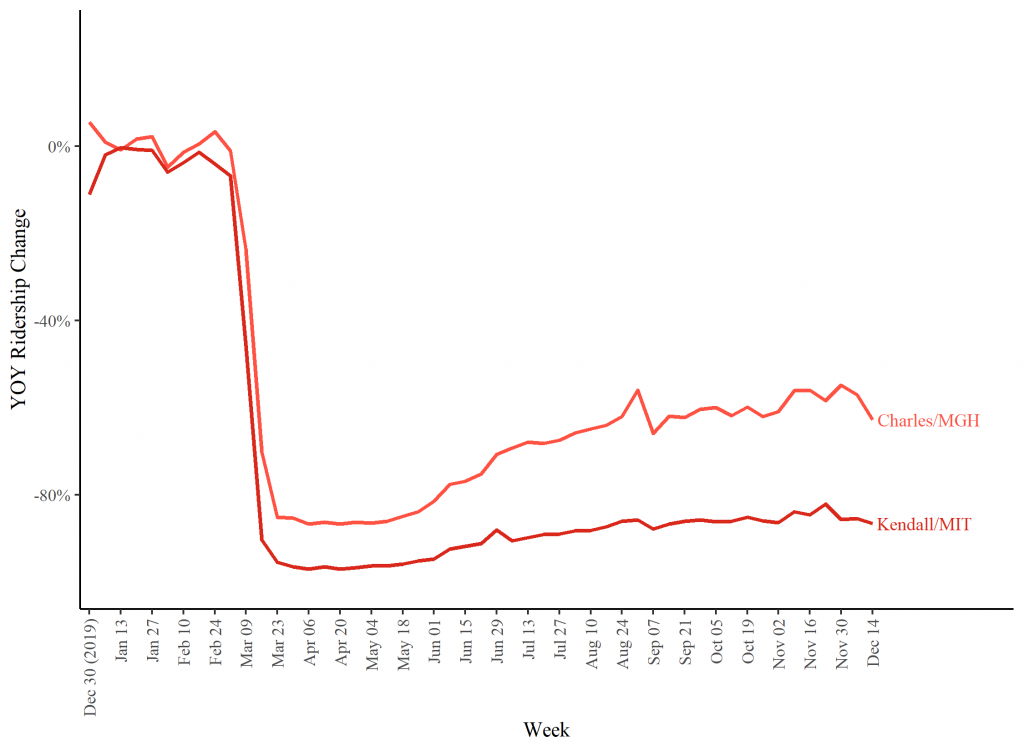
The influence of what types of jobs are near stations or along bus routes can also be seen. For example, rapid transit ridership retention is correlated with the number of medical jobs in the station catchment area. A greater number of jobs in the medical field correlated with greater ridership retention. This aligns with expectations given the unique circumstances of the pandemic as a ridership disruption, where throughout the pandemic medical workers continued to make trips. Consistent with the system-wide pattern that the model confirms, we see this pattern play out at Charles/MGH and Kendall/MIT. Validations at Kendall dropped to a lower point and stayed lower throughout the year than did validations at MGH, just over the Longfellow Bridge.
The influence of occupation type is also seen on bus ridership. In addition to the transit criticality index, the number of retail-sector jobs was significantly correlated with greater ridership retention throughout the pandemic. This highlights the variation in trip generation among different types of occupations. Retail jobs generate more trips than other types of work — in addition to workers themselves, retail stores serve as destinations, resulting in more trips on a given route. In contrast to the total number of jobs in a census tract was negatively correlated with ridership retention (consistent with the high proportion of teleworking).
The analysis builds off some of the themes discussed in previous ridership data exploration, statistically confirming some hypotheses about ridership during COVID. Further, the difference between residents and riders can be seen in the data. The longer report can be found here, and visualizations of ridership and other trip-making can be found on the MassDOT Mobility Dashboard.