Fare collection was temporarily suspended when the MBTA implemented mandatory rear-door boarding on buses and trolleys at street-level stops due to safety reasons during the pandemic. On July 20, after safety protocols were put in place, fare collection on buses and trolleys at street-level stops resumed along with the resumption of front-door boarding.
While ridership remains far from normal, the return to fare collection provided a natural experiment for learning more about how the system is being used and how passengers respond to fares. Being curious, we dug into the data a bit to examine what happened after fare collection resumed. Usually, when fares change, we see a corresponding change in ridership that can be explained to some extent by elasticity: as cost to passengers increases, ridership drops, and vice versa. In this case, there are some confounding circumstances which are likely affecting ridership:
- Most importantly, because of the pandemic, many usual riders are not traveling, and non-essential trips are discouraged. The concern over safety and general guidance to stay home is likely to have had a far greater impact on travel than changing fares. We would therefore expect a lower elasticity effect on the trips still being taken, since we believe more trips than usual are by passengers with few other choices.
- The subway system continued normal fare collection throughout the entire time period, and the MBTA provides free transfers between bus and rail. The T also has a number of bus routes that “feed” into the subway system. This means that for many trips, there was no difference in cost when bus fares were not collected, as passengers would need to pay the subway fare on the other leg of their journey.
- Fare collection was only paused for four months, and the pause was for safety reasons, so we would not expect to see passengers change their behavior in the way they might if it were a permanent change (for example, selling their car). Economists usually describe both “short-run” and “long-run” elasticity; in this case we only saw the short-run.
The rest of this post will discuss the changes and provide some hypotheses about what might be causing the changes and what they might mean.
Limitations
Unfortunately, we by definition do not have any Automated Fare Collection system (AFC) data from the time when fares were not collected. That means we are unable to run our Origin-Destination-Transfers model (ODX) for that time period, nor can we follow particular cards or tickets over that time to see how their behavior may have changed when fares were re-instated. We at OPMI are used to having multiple data products at our disposal; during the pandemic, we’ve been unable to use many of them and have been limited in our ability to do field work or in-person surveys. So, we have to work with what we can. In this analysis, we largely used the Automated Passenger Counter (APC) data, which does not depend on fare collection and previous runs of ODX.
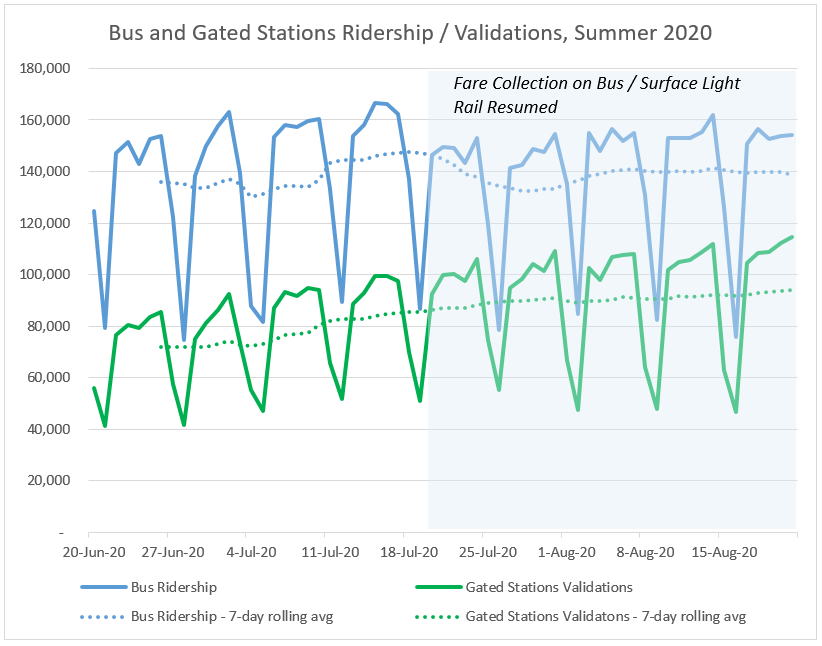
The above chart shows the bus ridership (from APCs) and the total gated station validations (from AFC) for the month before and after fare collection was resumed, along with a 7-day moving average. As you can see, while the trend on both bus and subway was slightly positive, when fare collection resumed on July 20, we saw a drop in bus ridership. This drop was about 9% from the week immediately previous to the fare collection change.
At the route level, we see a wide range in the ridership changes. Comparing the average ridership by route for the two weeks before fare collection with the average ridership for the two weeks after (and excluding routes with fewer than 500 passengers daily), the routes ranged from the SL3, which increased its ridership by 4%, to the 41, which dropped by 22%. Among Key Bus Routes, the biggest drop was the 1 with 16% fewer riders, and on the other end was the 28, which gained 2%. We have mapped the routes and shaded them by the amount of the change in the following map. You can also download the source data here.
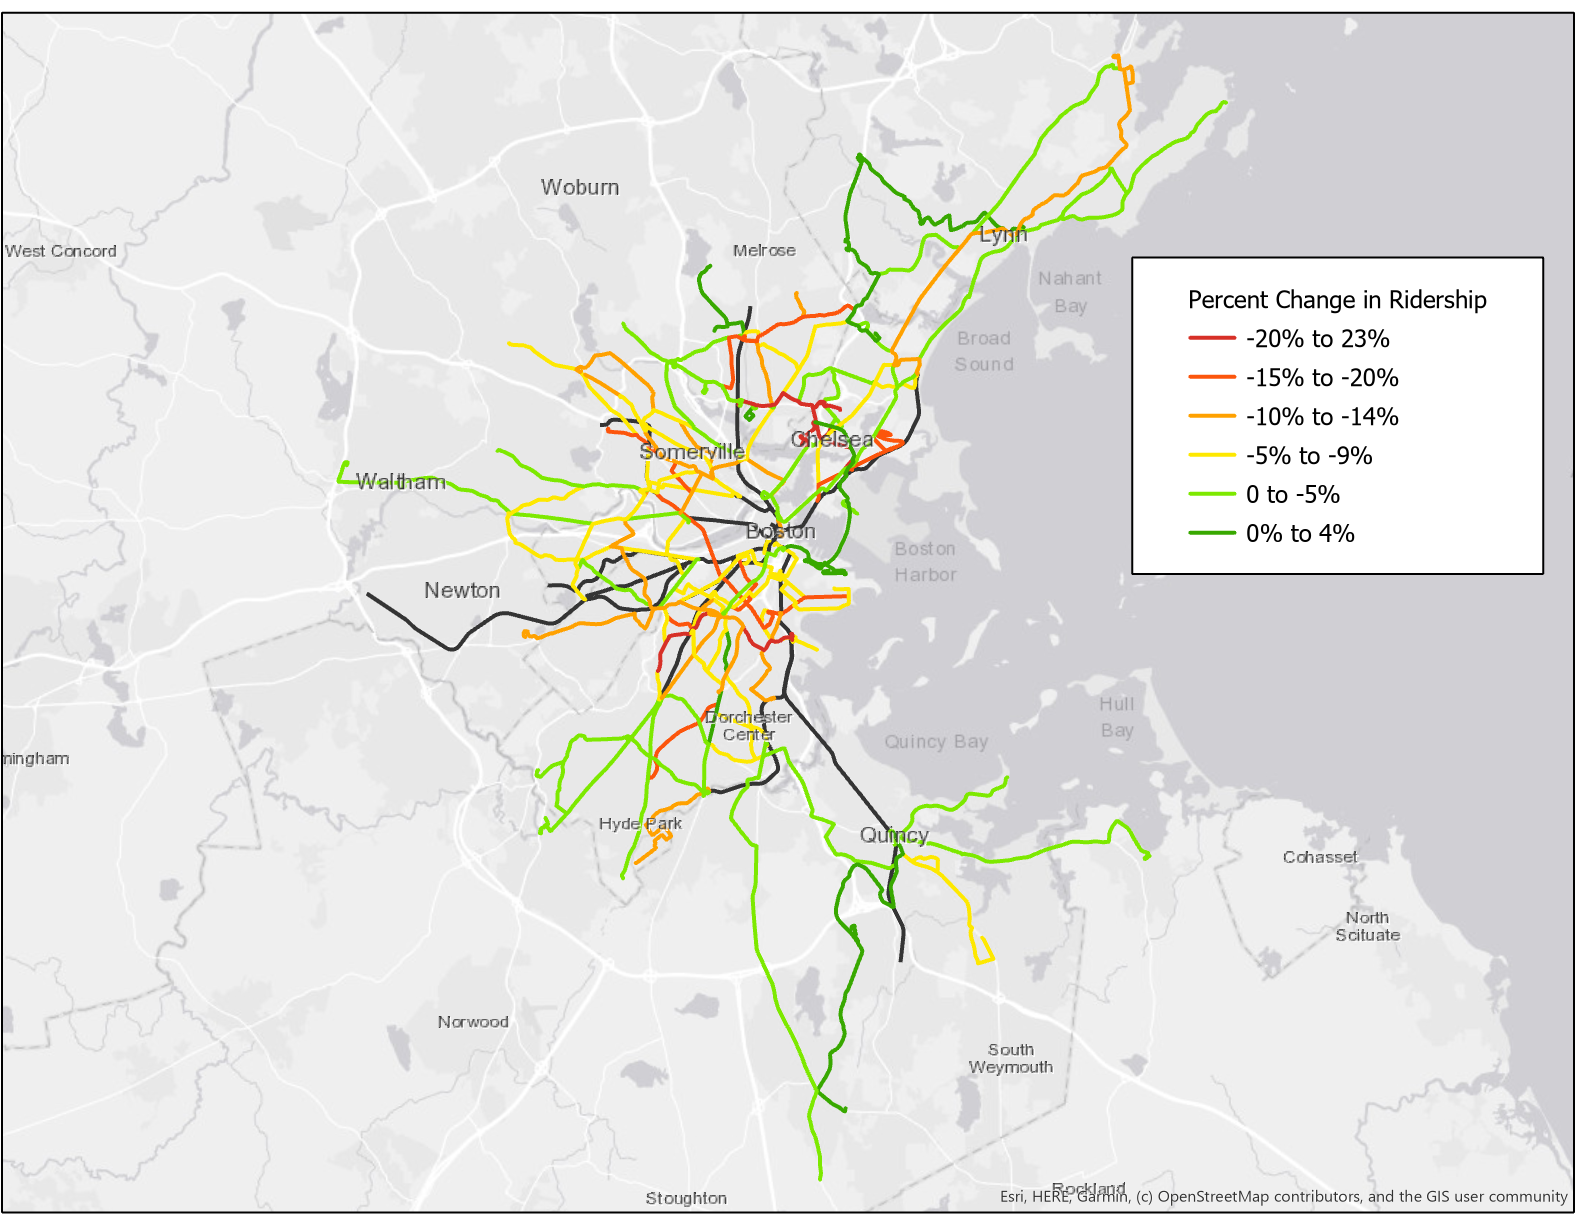
There does not seem to be strong geographical variation in which routes were most affected. On the whole, routes which run further outside of the city center and have less overlap with the subway system seem to be less affected, but there are counter-examples as well. It is possible that riders on these routes have fewer other options, so they continued to take trips via bus at the same rate. For trips where passengers had a subway option, perhaps some passengers chose the bus leg when it was free but then either switched to subway or just walked further when bus fare collection resumed.
To test whether routes that are more often part of a multi-leg journey were less likely to lose ridership (discussed in bullet point 2 above), we first queried ODX to find how often a trip on each route was part of a multi-leg journey. We used data from July 2019 for this purpose — obviously data from 2020 would be preferable, but was not robust enough at this time. Below is a scatterplot of the transfer rate plotted against the change in ridership from before and after fare collection.
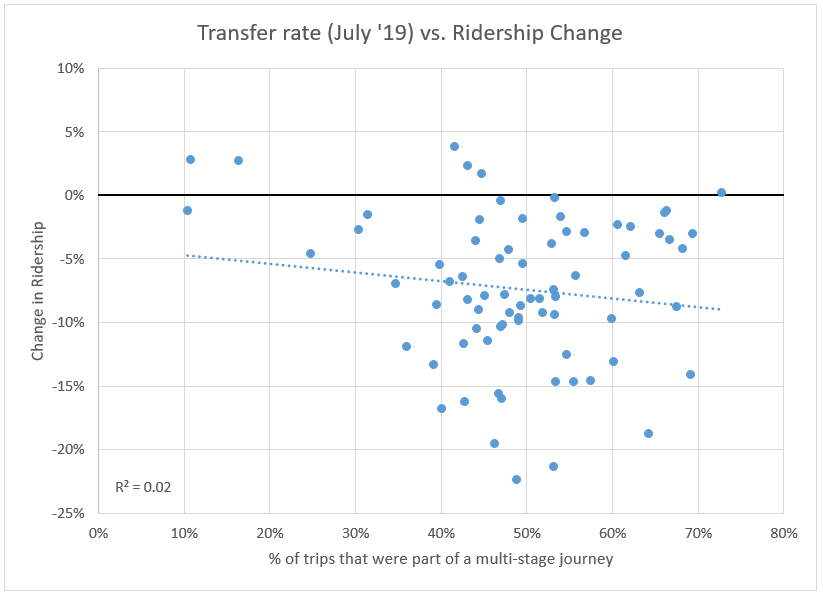
From the scatterplot, the two measures don’t seem to correlate: the relationship is weak, and it is in the opposite direction from what we hypothesized. As transfer rate of the route increased, ridership actually tended to drop more. While the weak correlation does not disprove this hypothesis, it is likely that other factors are in play.
While we were unable to draw many conclusions from the difference in routes, we will keep thinking about this and as we get better data from 2020, will revisit the analysis. If you have any hypotheses about what factors may have affected these changes, email us at opmi@mbta.com. We’ll update on the Blog if we discover anything!