In the past two posts, we’ve given an overview of how ridership changed during the pandemic, both over the course of the year and spatially throughout the system. In this post, we’ll take a look at how patterns of ridership changed temporally on a weekly and daily level.
Ridership by Time of Day
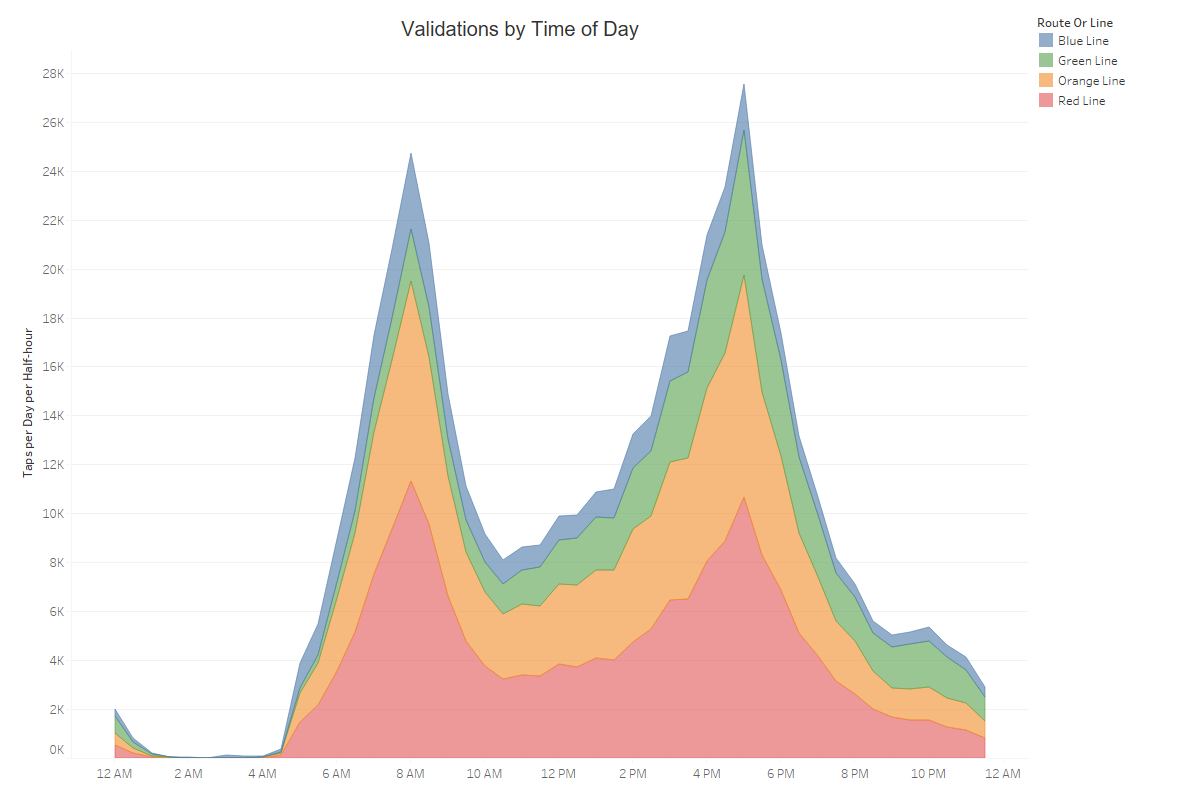
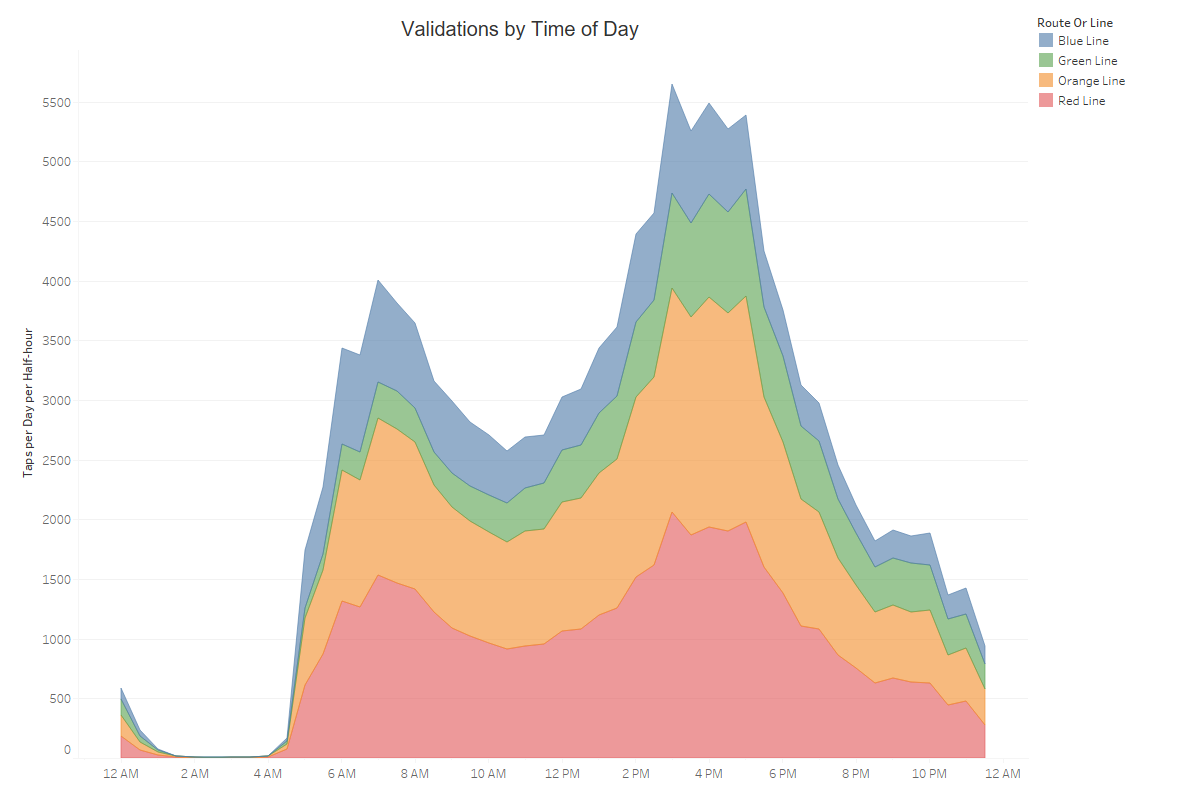
Early on in the pandemic we showed these charts that show taps over the course of the day. We have updated them here, showing total validations per half-hour both for weekdays in Fall 2019 (9/1/19-12/31/19) and Fall 2020 (9/1/20-12/31/20). The updated charts look pretty similar — the pattern of ridership over the day did not change a lot from the beginning of the pandemic to the end of 2020. This suggests that those “essential” workers who were still riding in March continue to drive the patterns of ridership, while some other riders have returned but not concentrated in particular times.
The most interesting thing about these charts is the broad spread of the peaks. While passengers in normal times are highly concentrated in the peaks (and really, in the peak-of-the-peak) at 8 AM and 5 PM, we see in Fall 2020 that the number of boardings at 3 PM is almost exactly the same on average as the number at 5 PM. Additionally, the midday ridership is up to about 50% of the peak, while in Fall 2019 it was less than a third of the peak level. While we do not expect these patterns to continue in precisely the same way once we reach the “new normal”, even small changes in the concentration of passengers during the peak would have big implications for service provision, as often the extreme crowding at the peak-of-the-peak slows trains, increases dwell times, and reduces overall capacity.
Ridership by Day of the Week
We also saw different distributions of ridership throughout the week than we usually do. The following table shows the total validations at all gated stations on the average day of the week, for the same Fall 2019 and Fall 2020 periods as above. Holidays where the MBTA ran different levels of service than a weekday schedule are excluded.
| Year | Sunday | Monday | Tuesday | Wednesday | Thursday | Friday | Saturday |
|---|---|---|---|---|---|---|---|
| Fall 2019 Validations | 155,783 | 454,830 | 473,372 | 505,383 | 503,383 | 474,962 | 210,193 |
| (% of the week) | 5.6% | 16.4% | 17.0% | 18.2% | 18.1% | 17.1% | 7.6% |
| Fall 2020 Validations | 64,150 | 110,633 | 116,405 | 115,734 | 110,999 | 123,988 | 87,863 |
| (% of the week) | 8.8% | 15.2% | 16.0% | 15.9% | 15.2% | 17.0% | 12.0% |
We have also made a chart showing validations by time of day over each day of the week. These are similar to the charts at the beginning of the post, but all lines are added together. We’ve highlighted Fridays, Saturdays and Sundays as they show the biggest changes (click to enlarge):
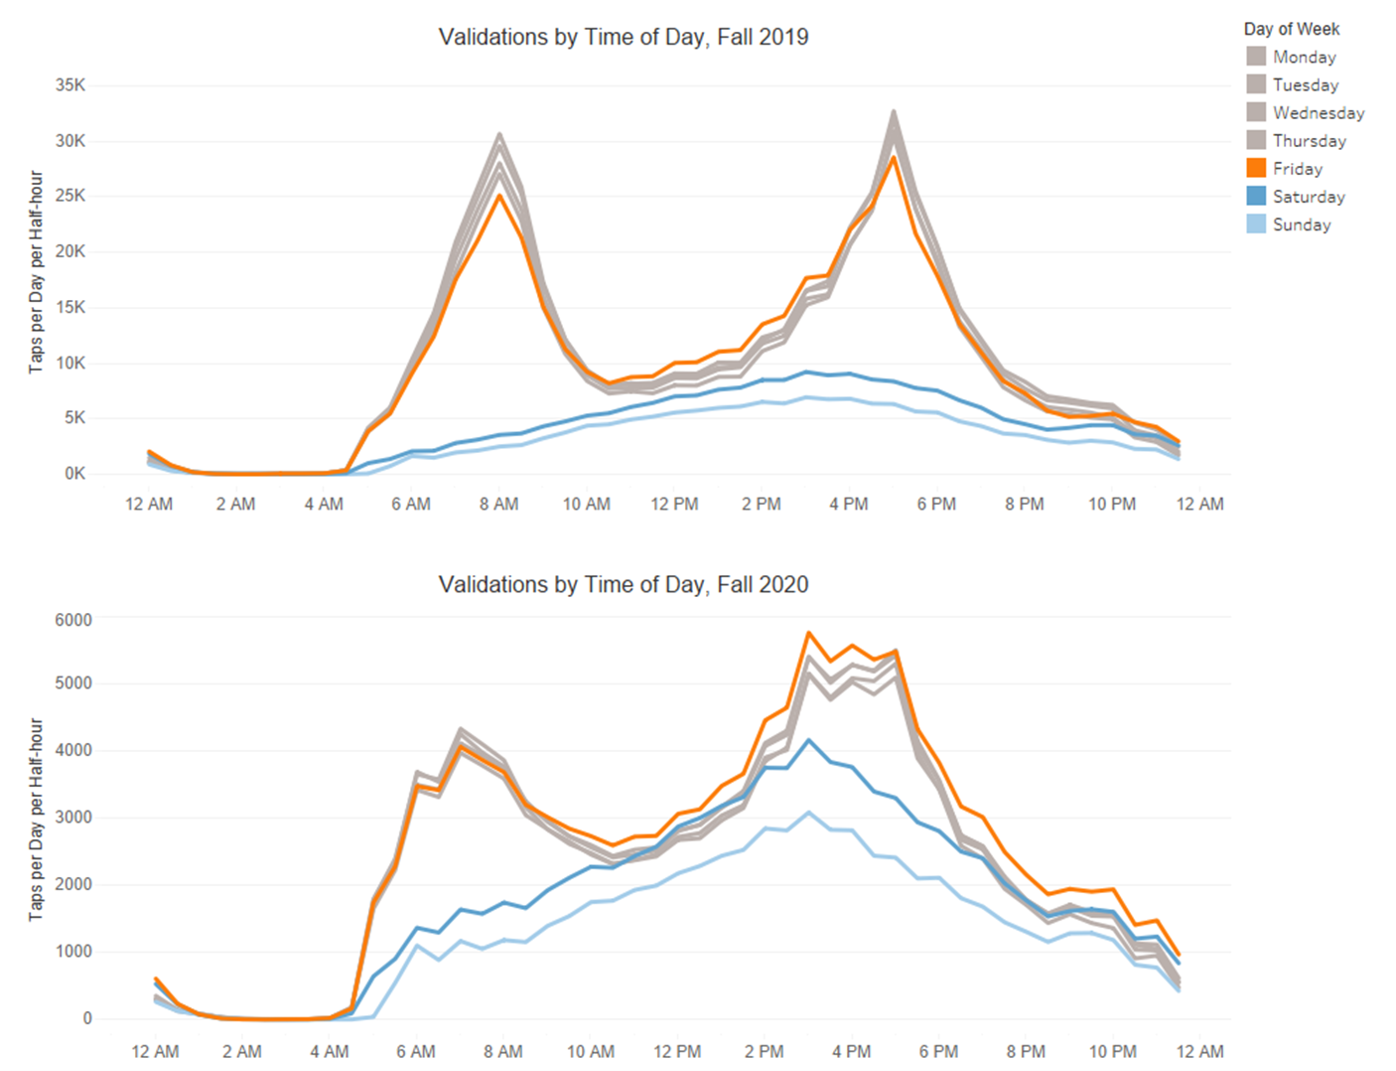
Usually, Wednesdays and Thursdays have the highest ridership levels, which makes sense since people tend to take days off either at the beginning or the end of the week. All weekdays in Fall 2019 ranged between 16.4% and 18.2% of the total validations for the week. In Fall 2020, however, weekdays were a smaller proportion of weekly ridership, ranging from 15.2% to 17% of the total, which makes sense given the lack of 9-5 commuters. Interestingly, Fridays were the busiest weekday in 2020 by a significant margin. In the time of day charts, it appears the Friday morning peak is similar to the other weekdays, but ridership increases in the afternoon and evening. It is possible these additional passengers are working from home most of the week, but then ride the system on Fridays as they end their week.
Weekend days provided a higher proportion of ridership than usual in Fall 2020. While Saturdays in Fall 2019 were 44% of the average weekday, in Fall 2020 they had 76% of the average weekday’s ridership. Sundays showed a similar pattern, increasing from 32% of the average weekday (in 2019) to 56%. Again, this suggests that passengers who rely on transit for travel continue to ride each day or have different schedules than the usual peak patterns, while those who tend to mostly ride during the week are no longer traveling or have changed their modes.
While research continues, the characteristics of ridership continue to show that transit provides an essential service for those who don’t or can’t drive cars and who are unable to work from home. The MBTA continues to keep a close watch on ridership and monitor passenger behavior in multiple dimensions: volumes over time, volumes by route and location, and behavior over the course of the day. While we expect 9-5 commuters to return to the system, the pandemic has emphasized that hundreds of thousands of passengers rely on the MBTA who cannot work from home, and those passengers tend to more often travel at times outside the traditional peak. To best serve those essential trips well on into the future, we will need to carefully examine travel behavior using all available tools, and plan carefully, thinking beyond the usual emphasis on peak travel.