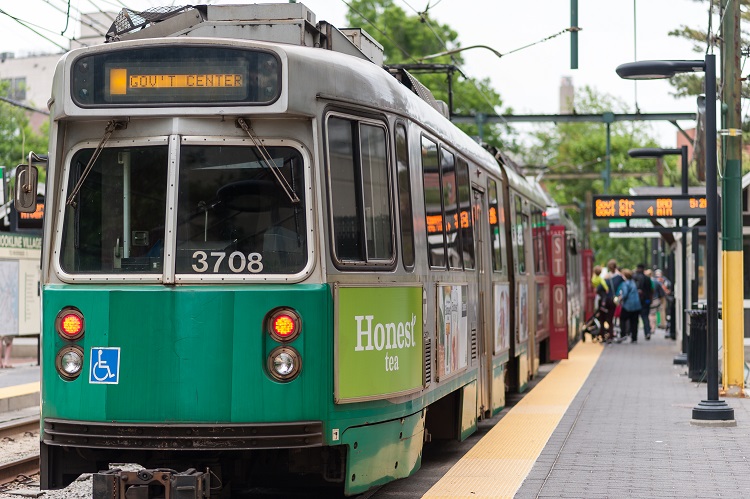
This post describes the technical details of tracking Green Line vehicles. The final output is included in the larger MBTA passenger data which feeds the new MBTA.com as well as apps like the Transit app. Read more about the format of the data at the MBTA Realtime portal.
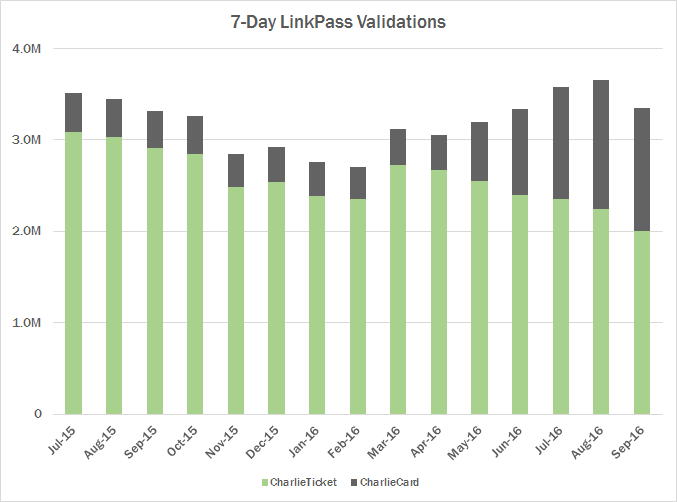
This article is a comparison of month to month usage of ridership across multiple modes.
Insight into providing 7 day charliecards which would reduce maintenance costs overall.
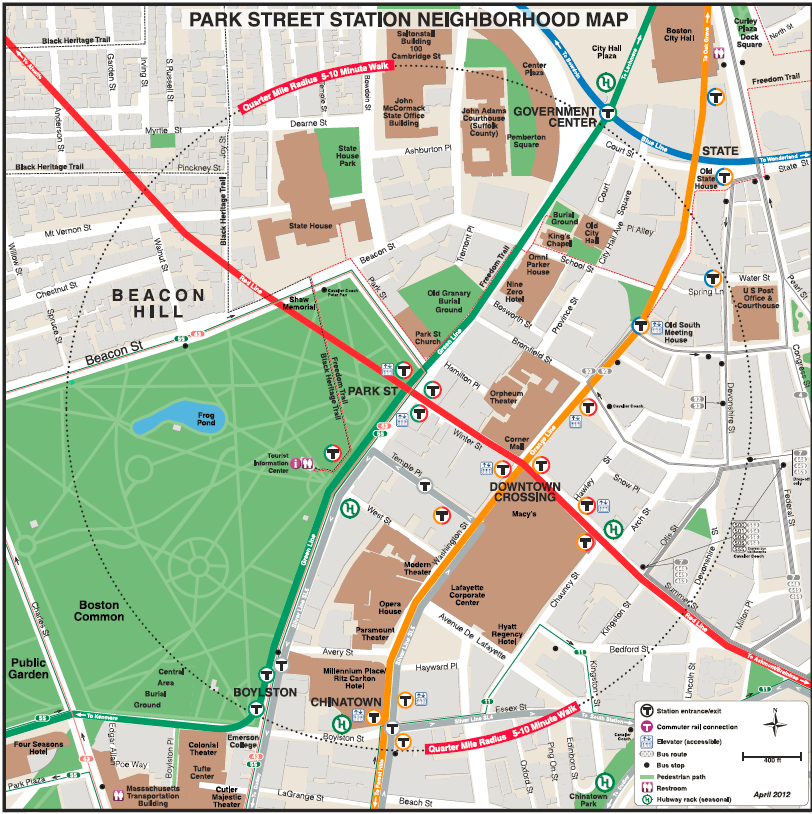
Analysis of how close a tranist station is in regards to walkability.
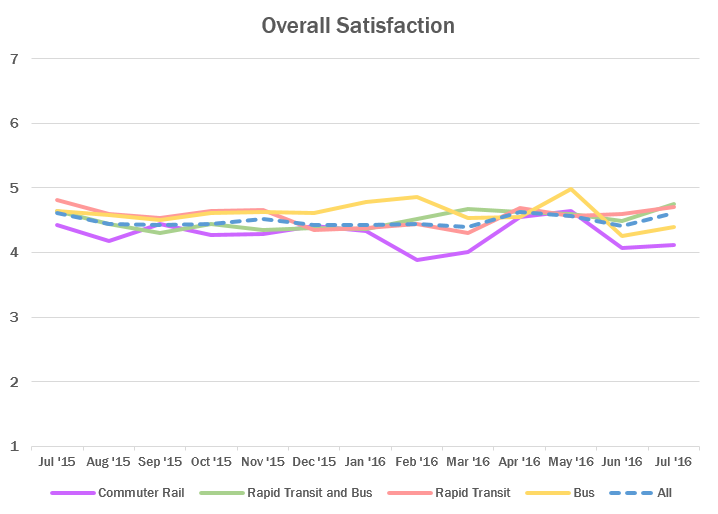
Analysis of why the commuter rail has the lowest satisfaction rates compared to buses and light rail.
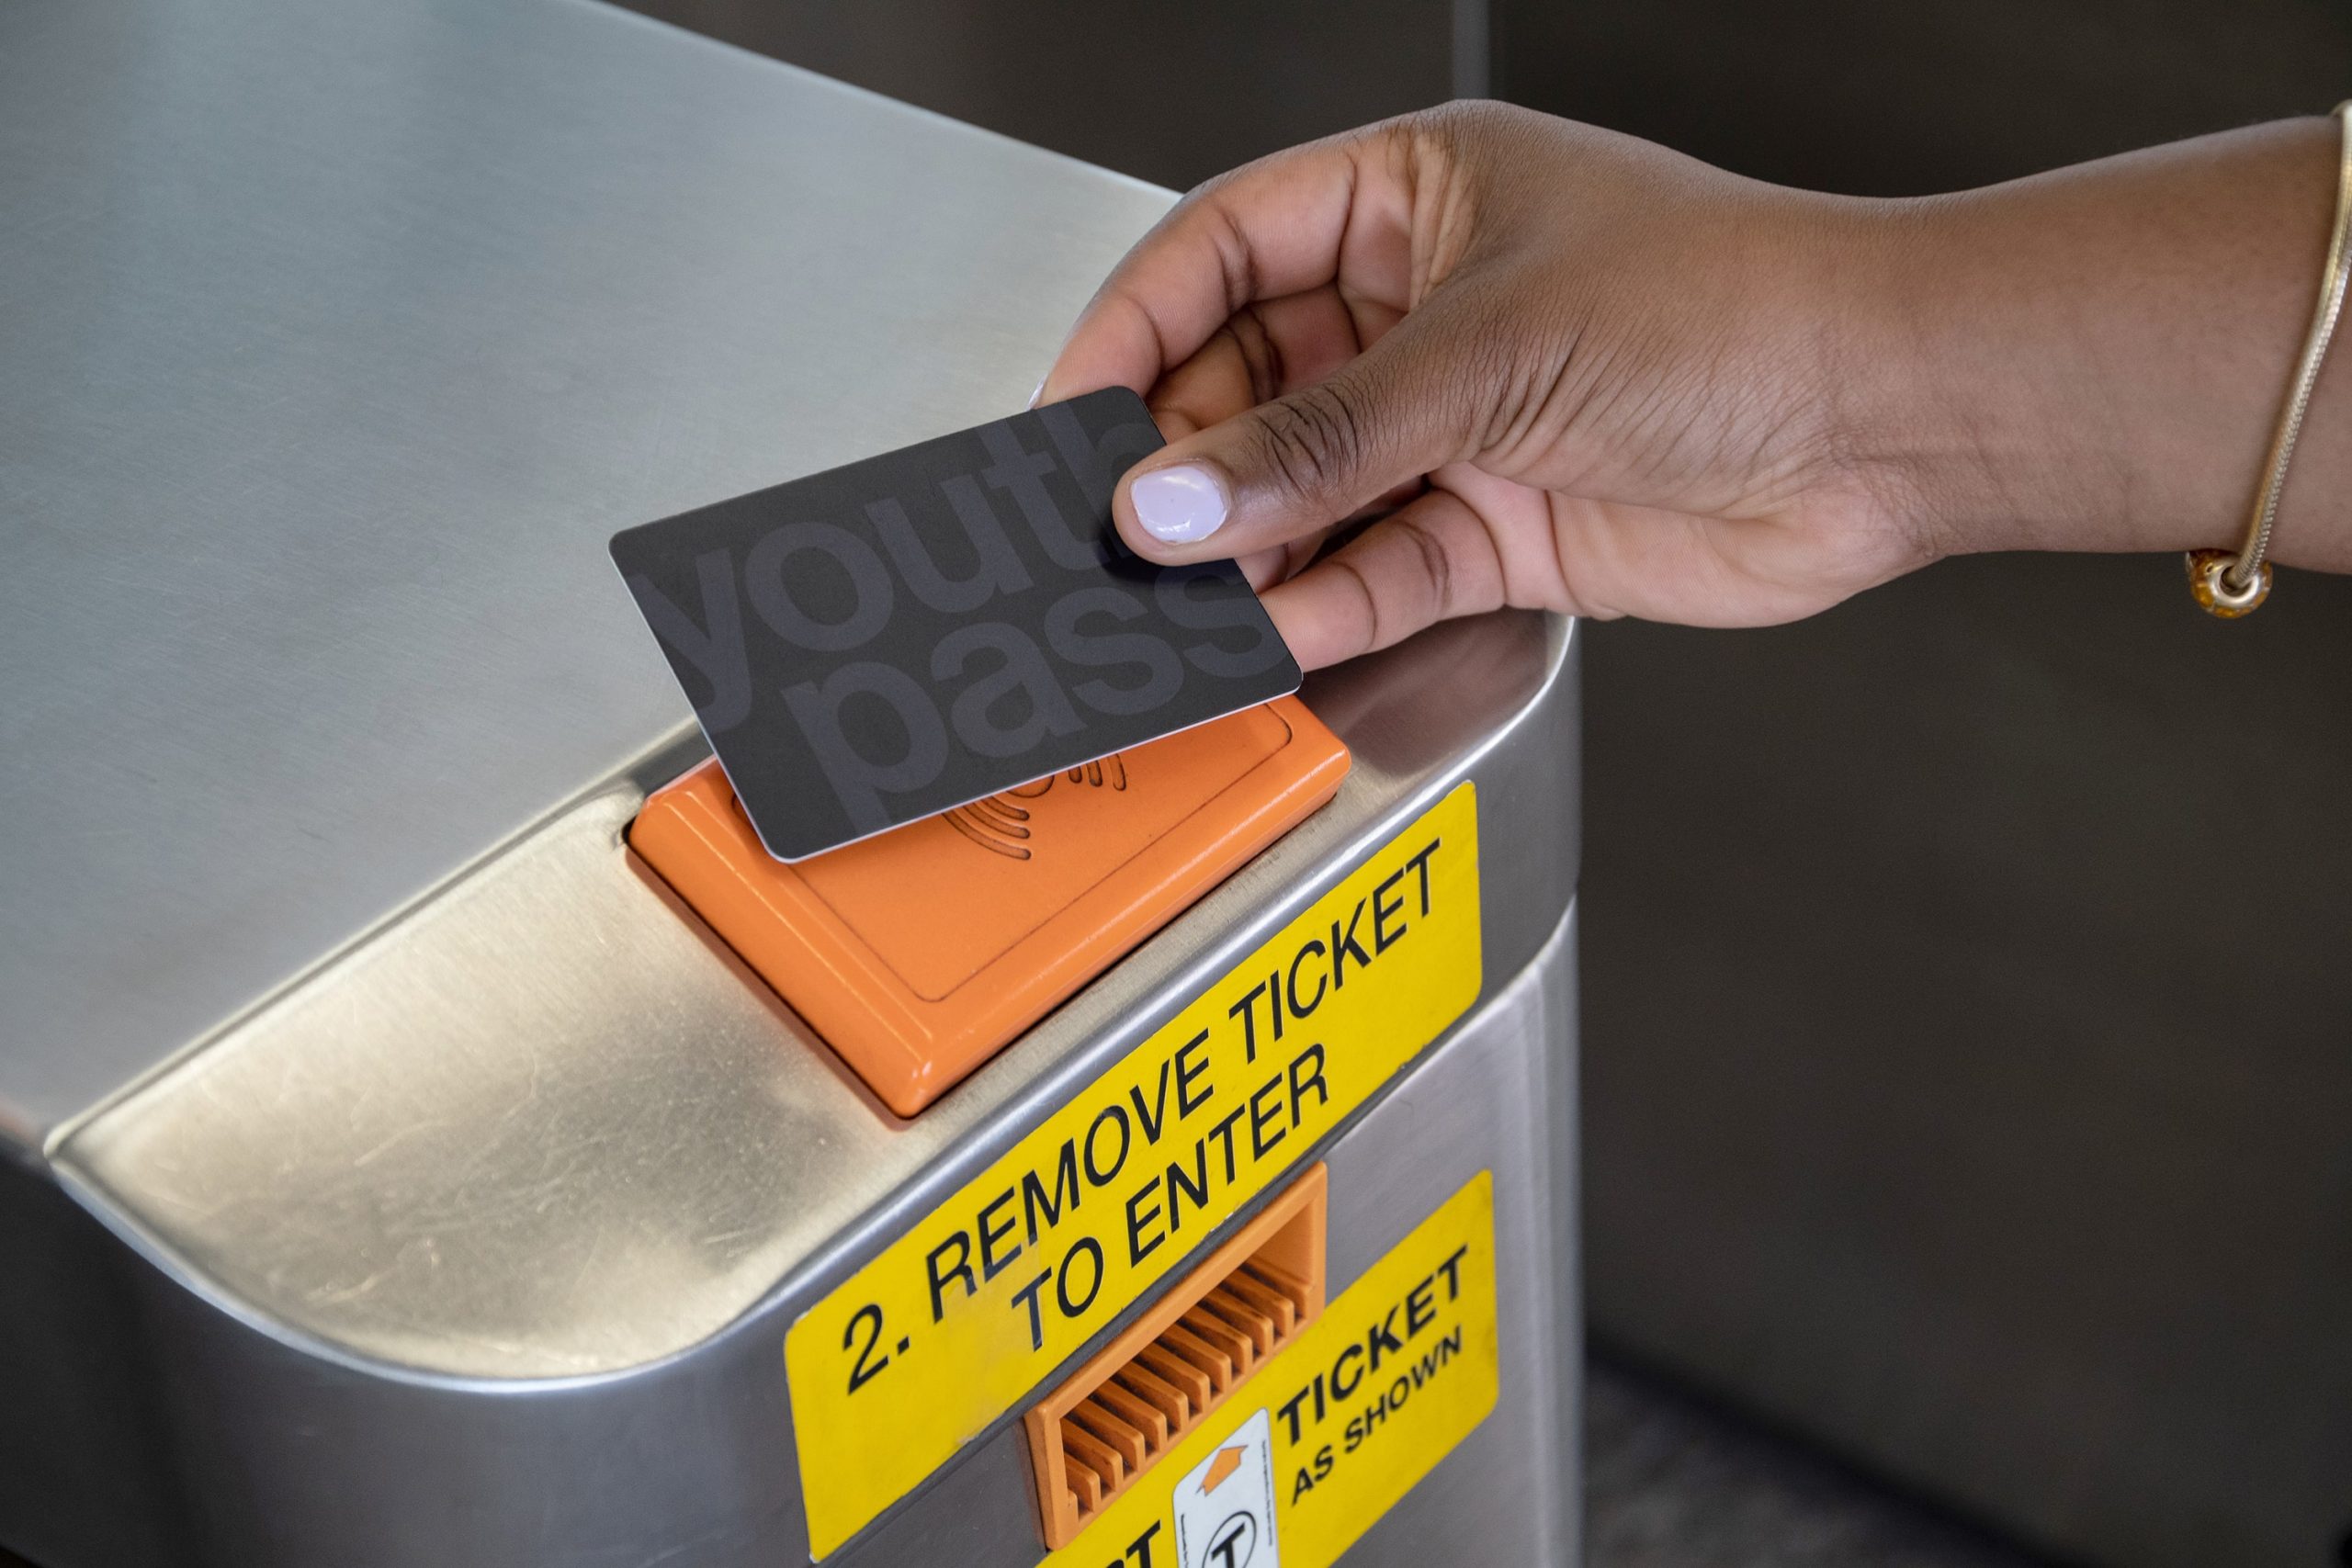
Analysis of Youth Pass Pilot which increased ridership by a large amount.
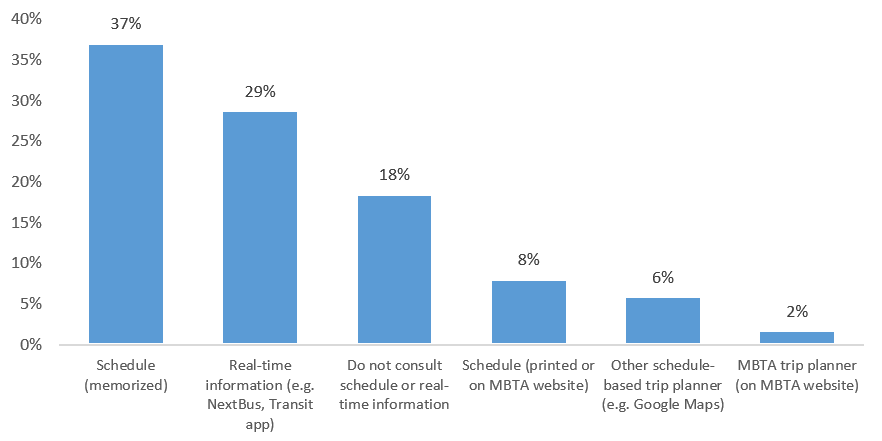
Analysis of how customers use tools to decide their route to destination through different modes.
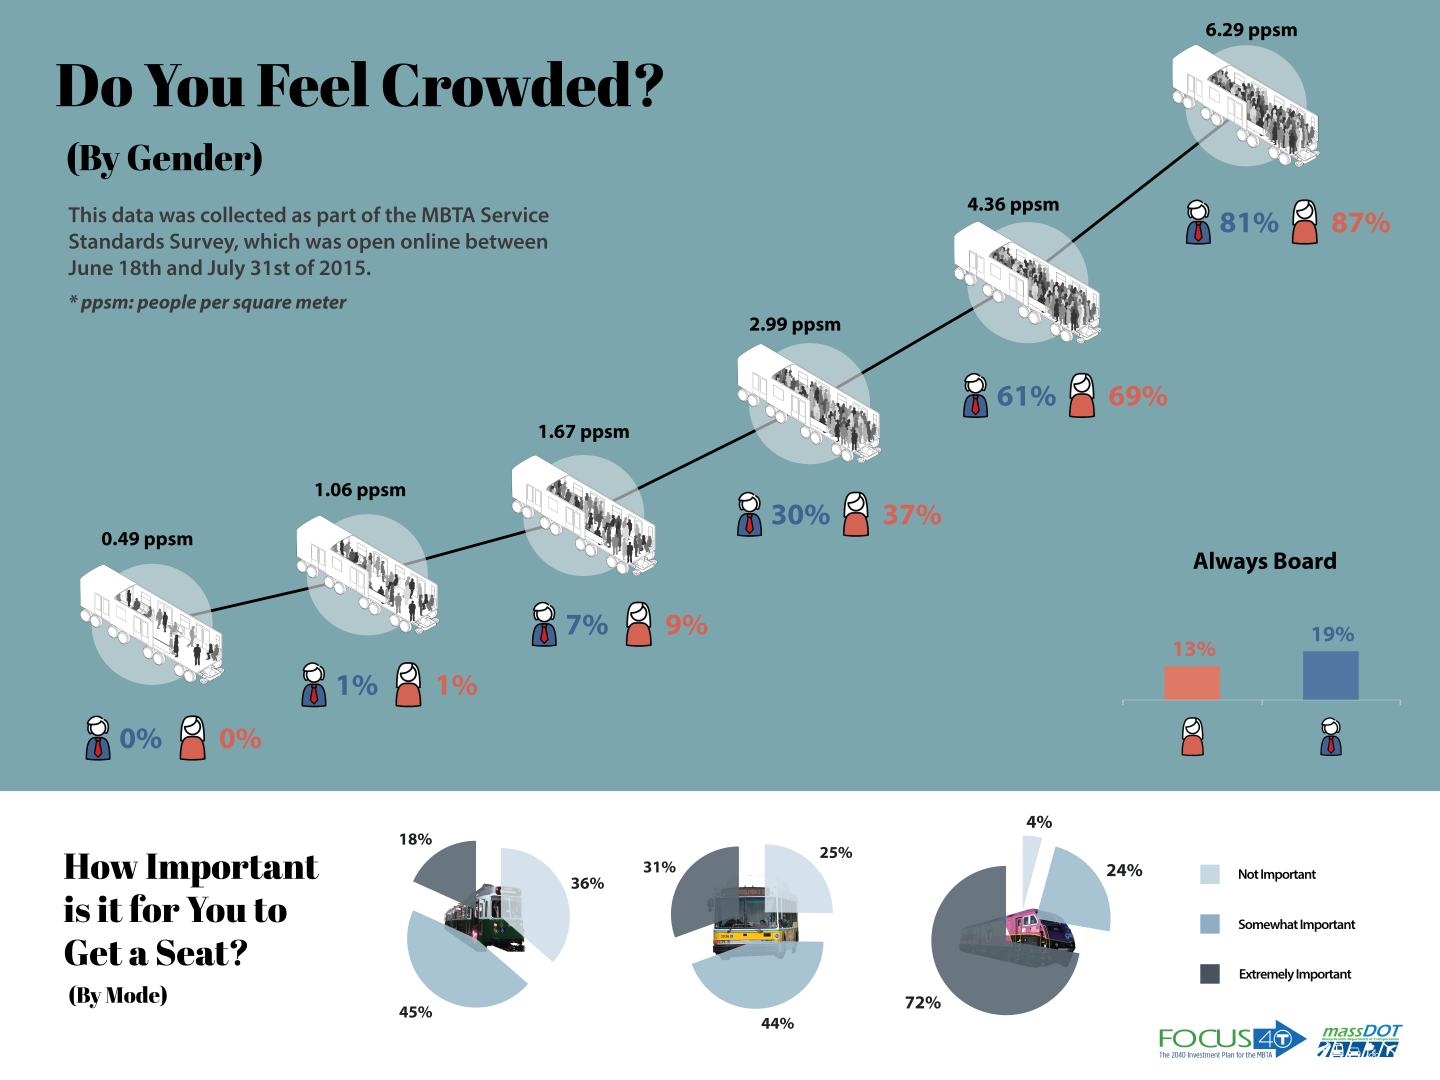
Panel used to determine at what point people will stop boarding a vehicle due to crowding.
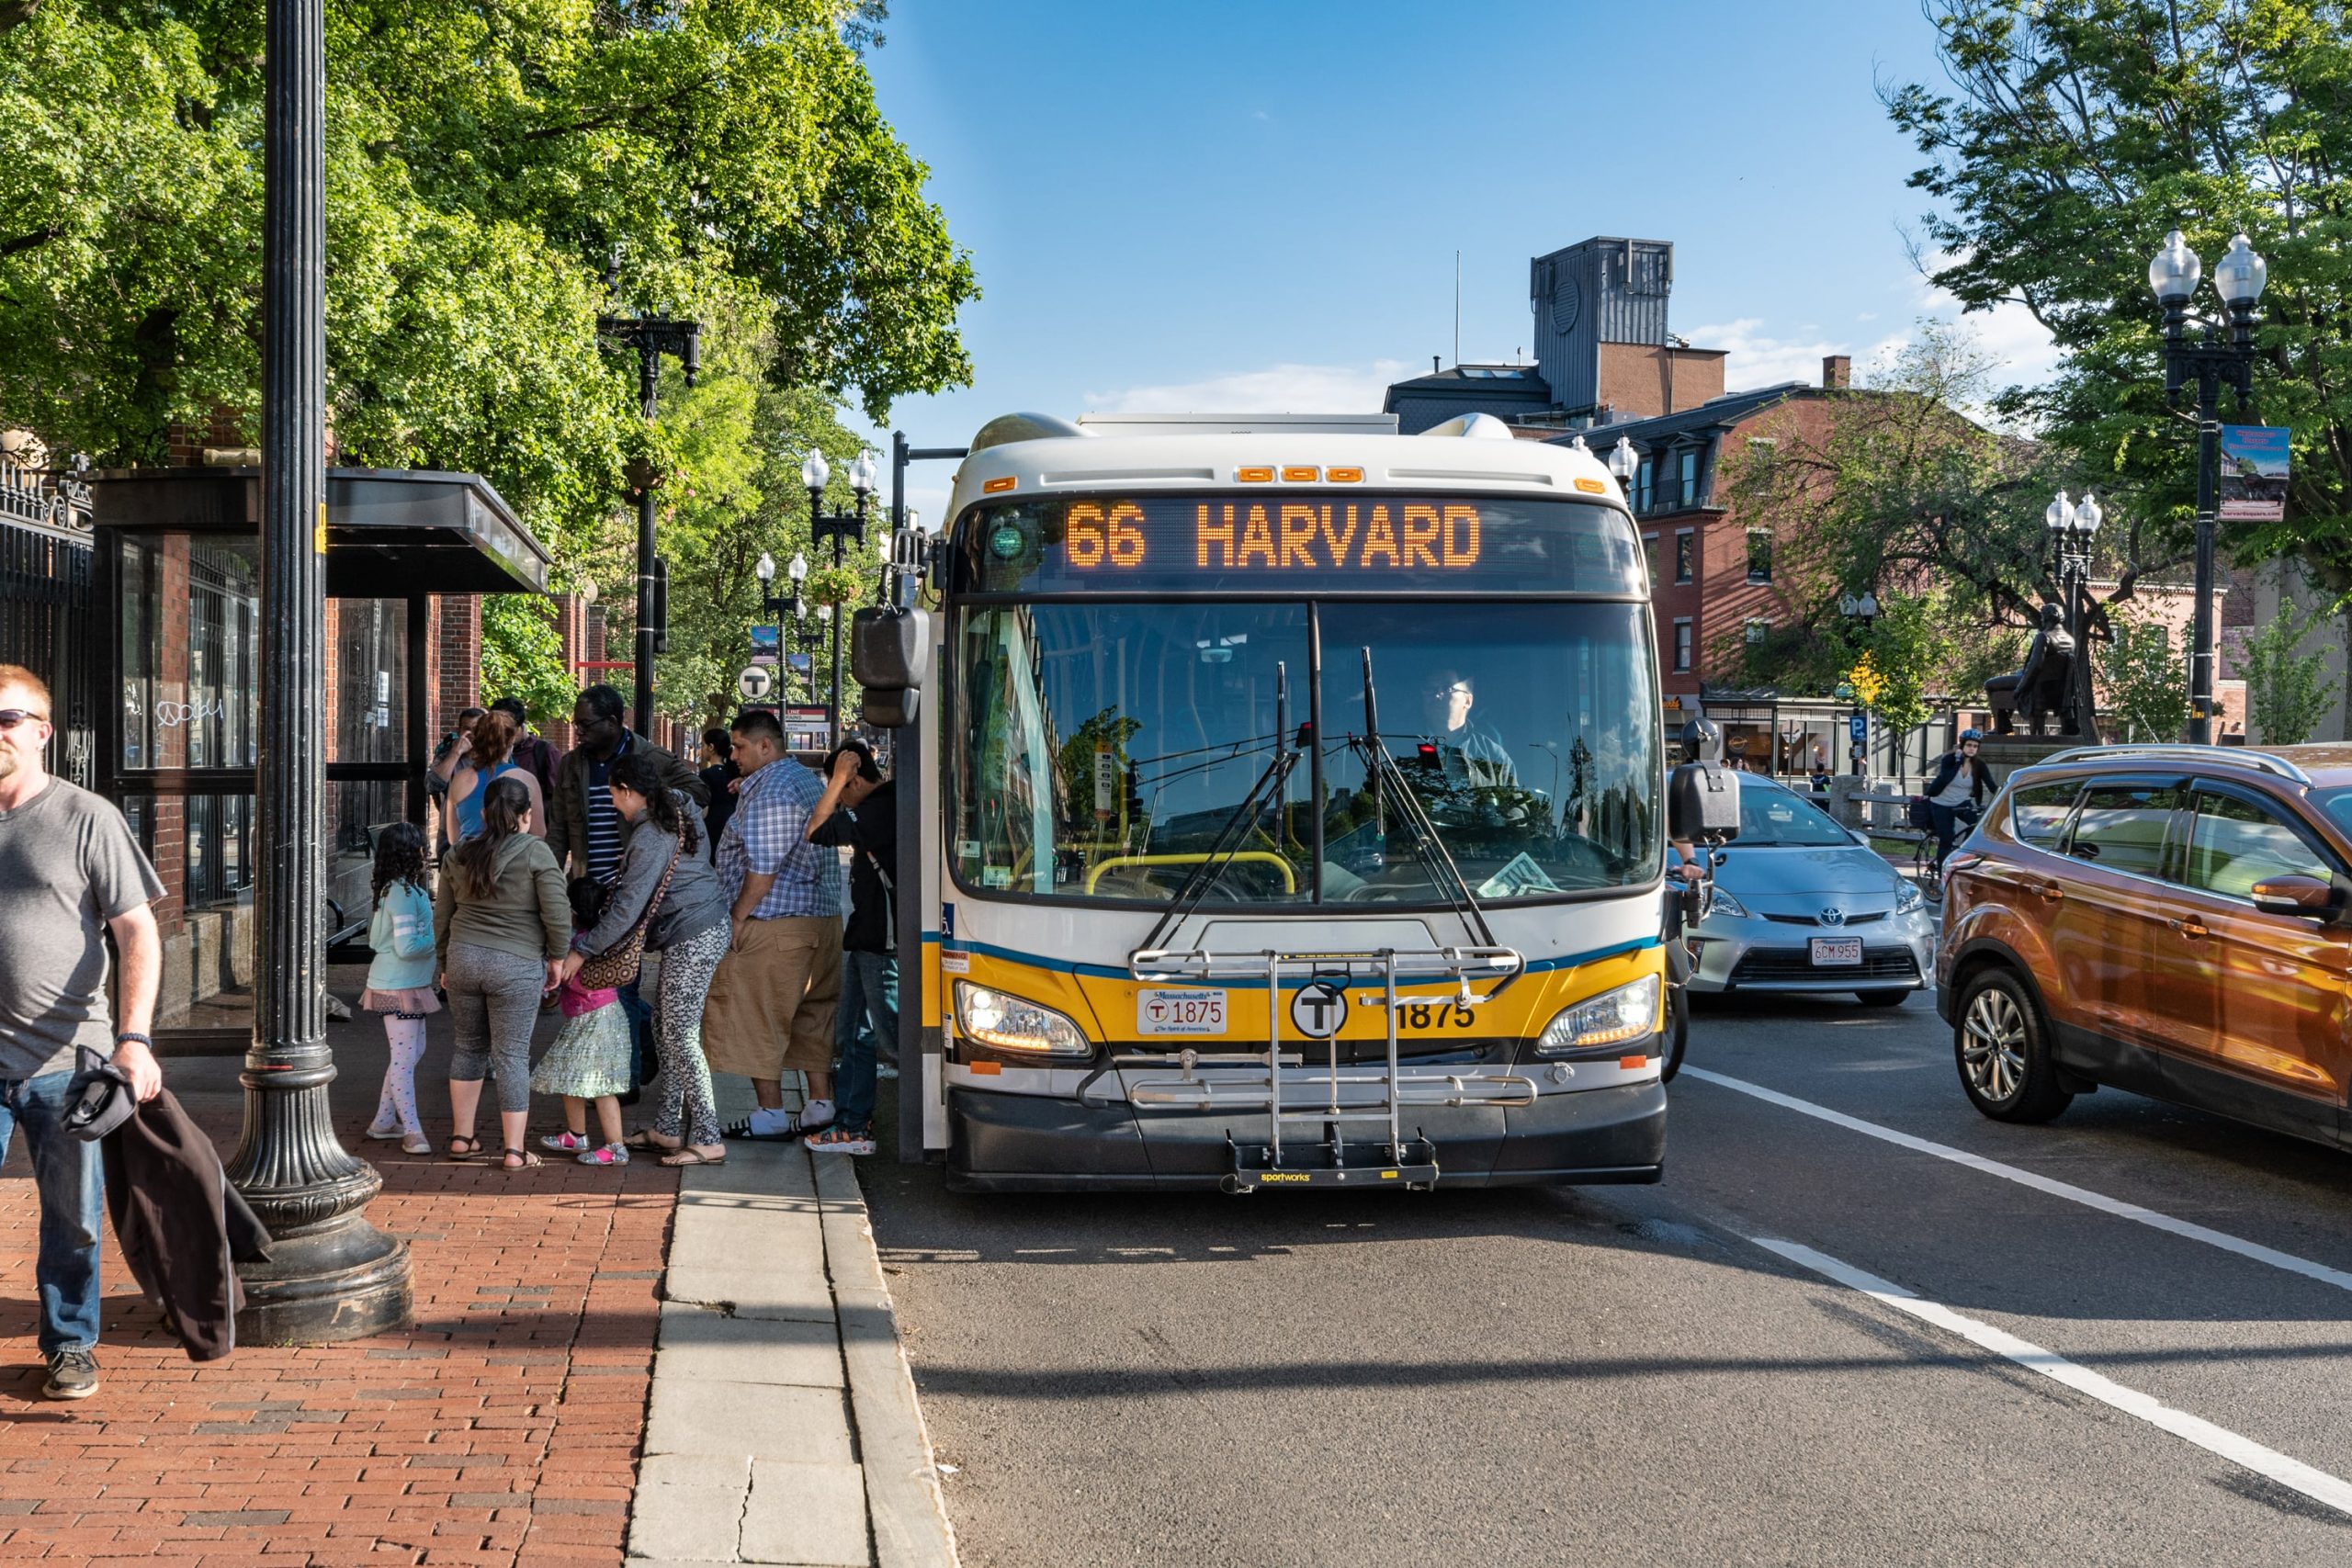
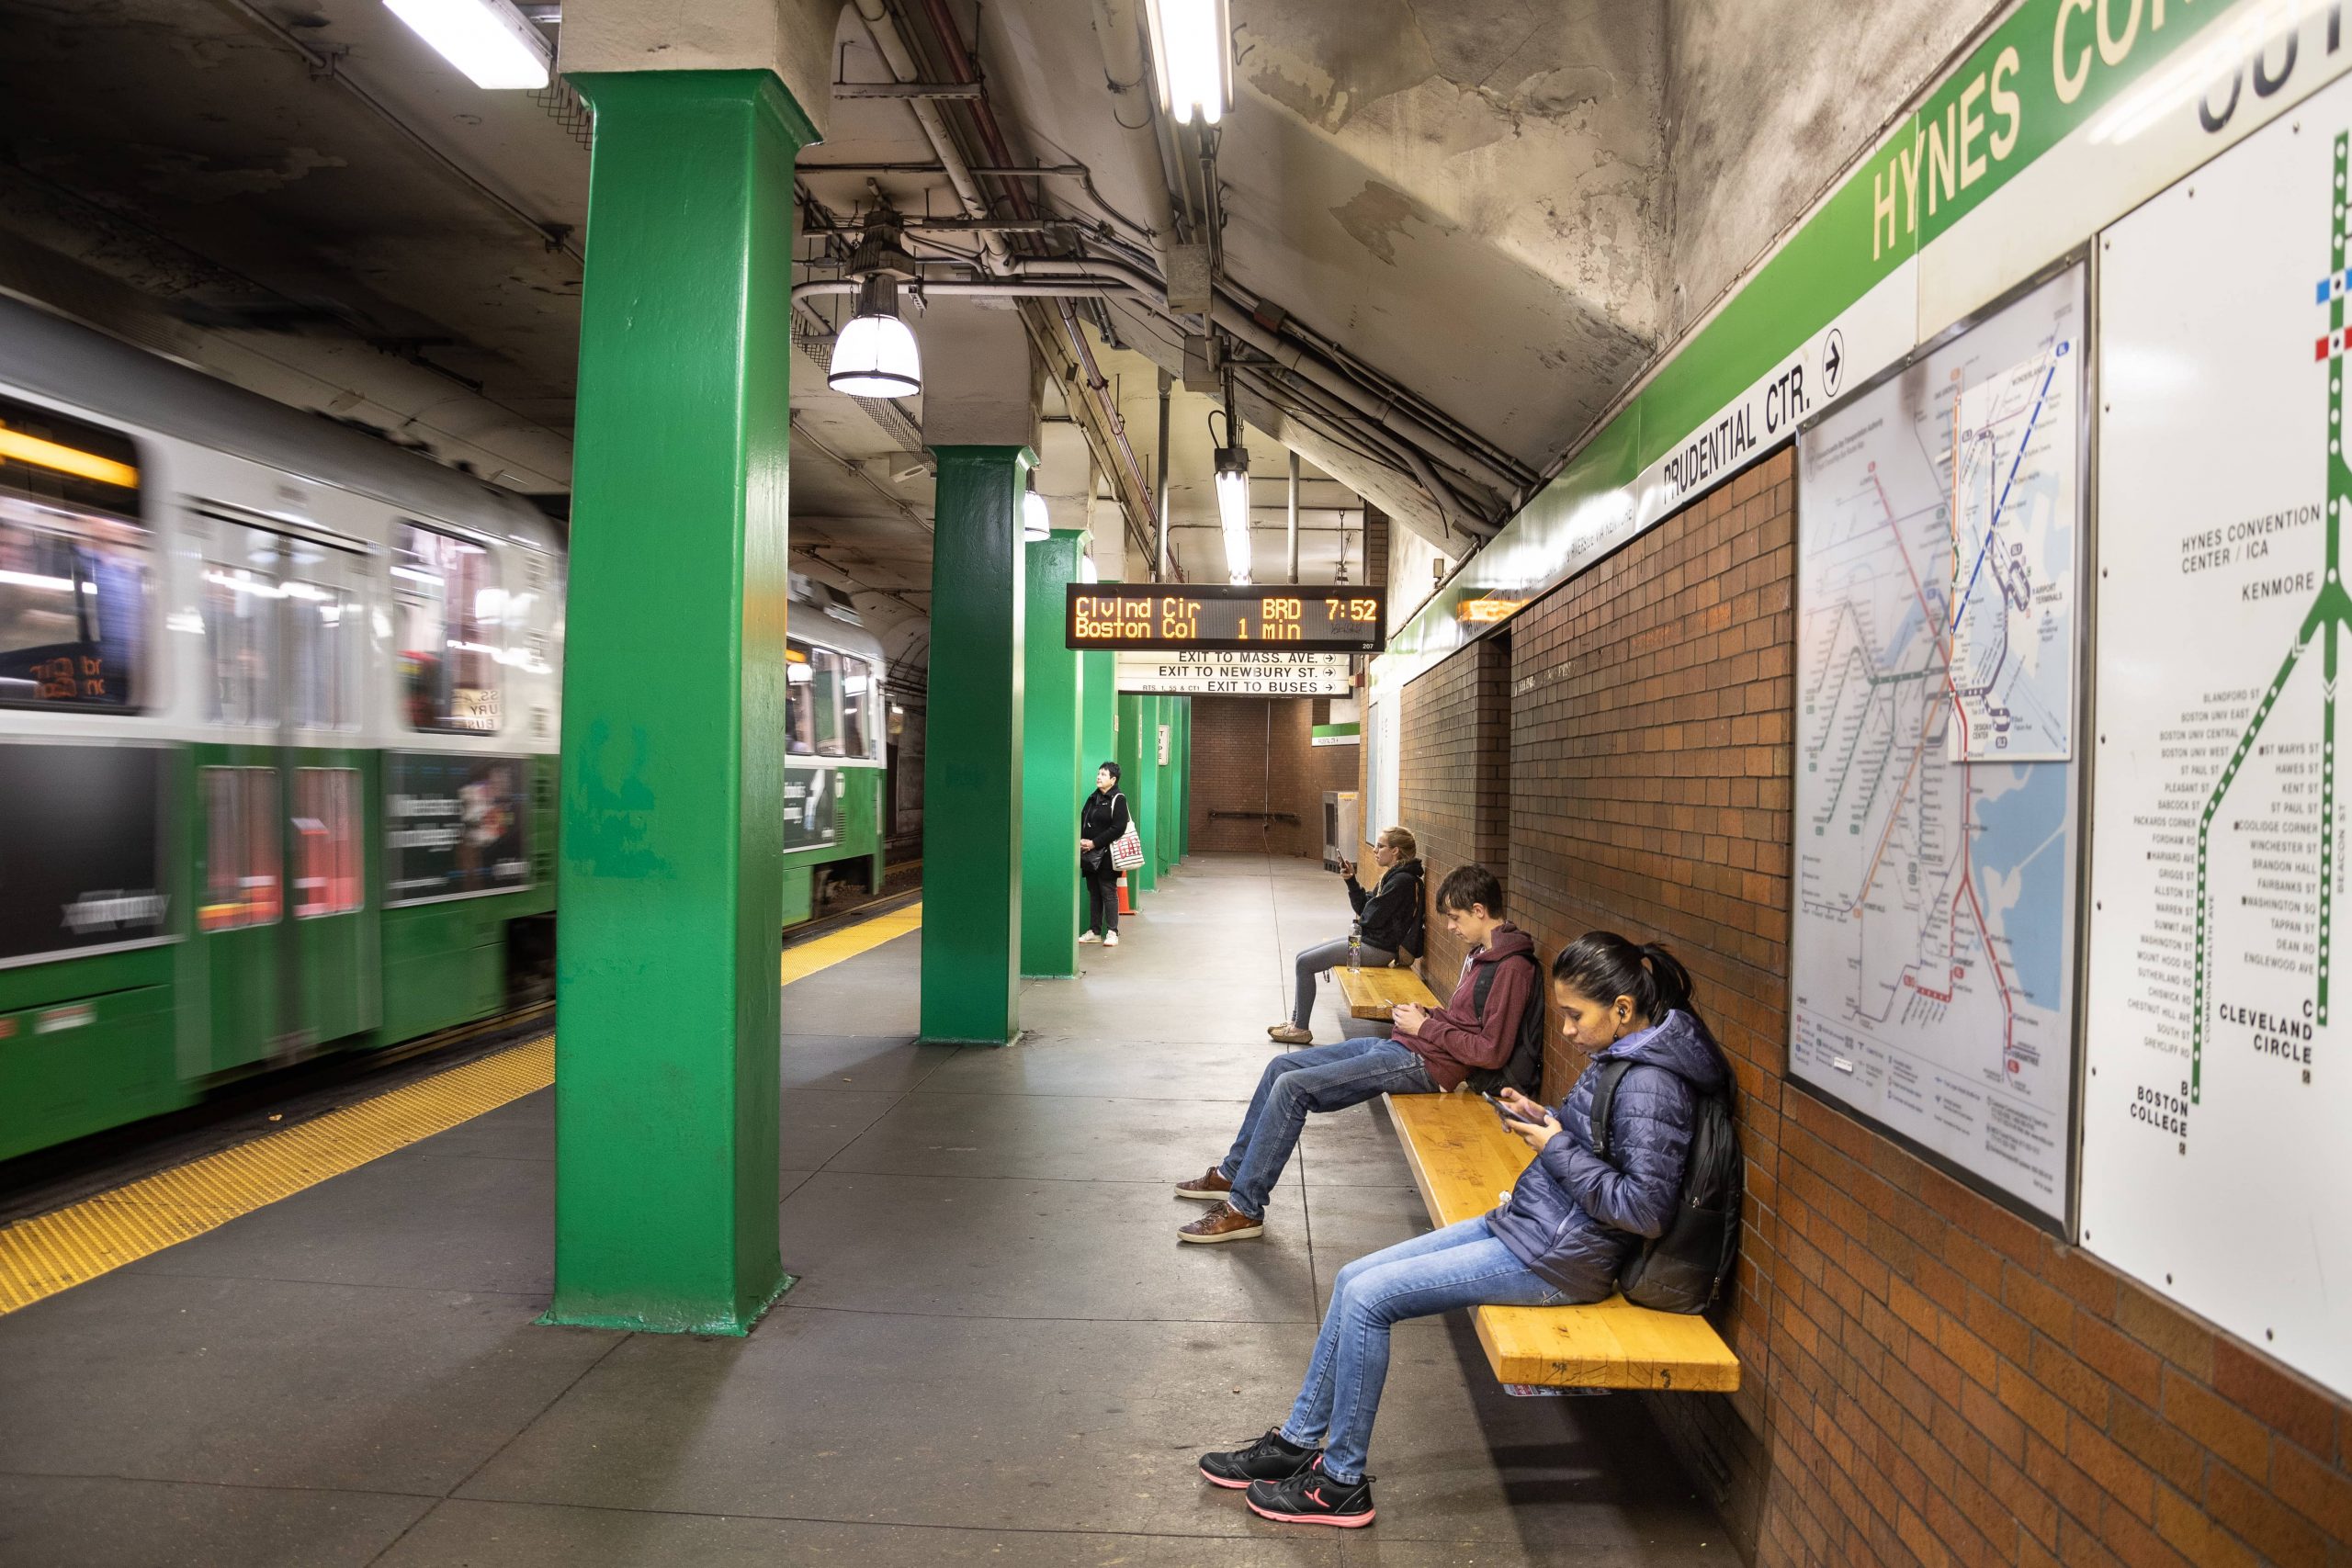
An explanation of how the MBTA tracks vehicles using GPS and other various tools.
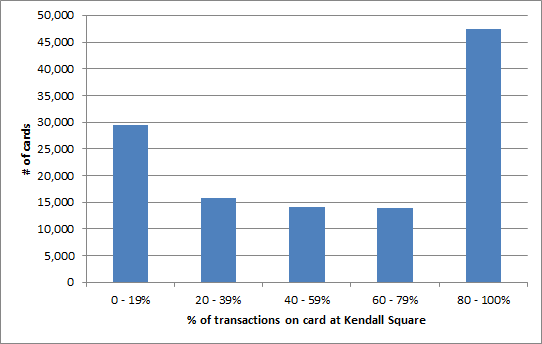
A look into the types of fraes purchased at various stations and what that data may suggest.