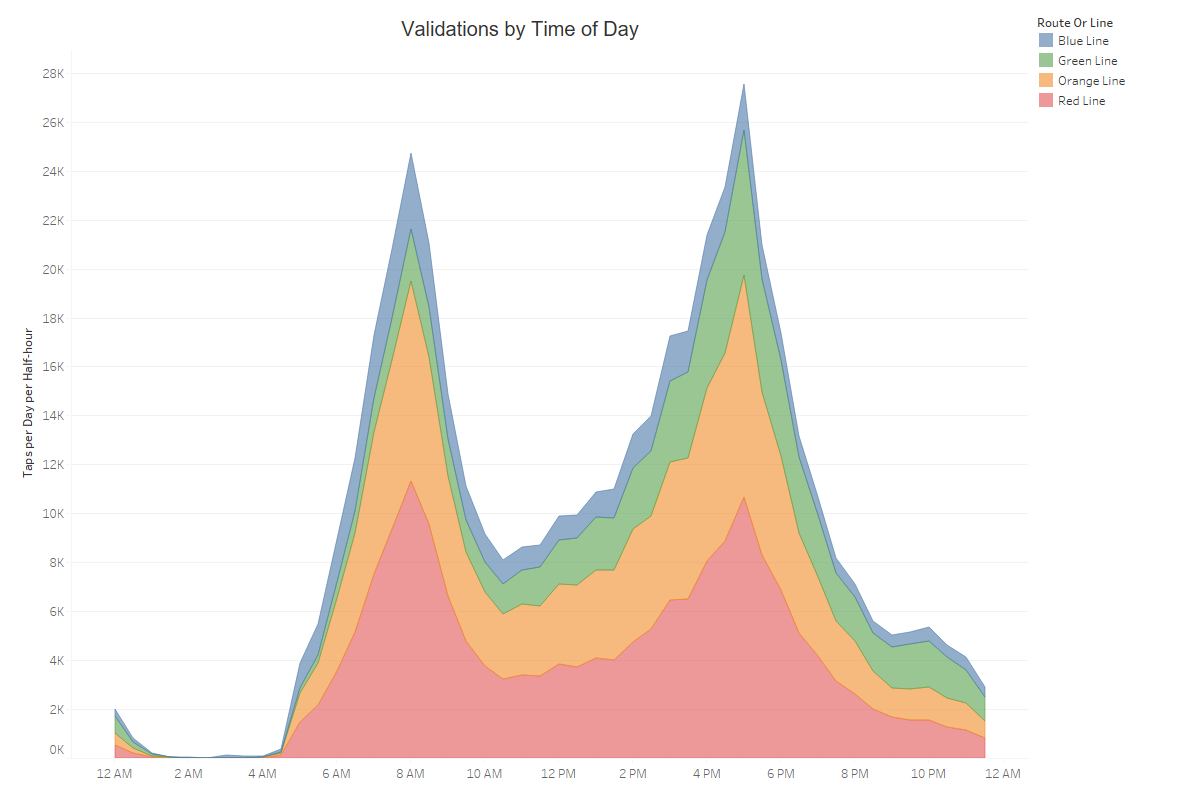
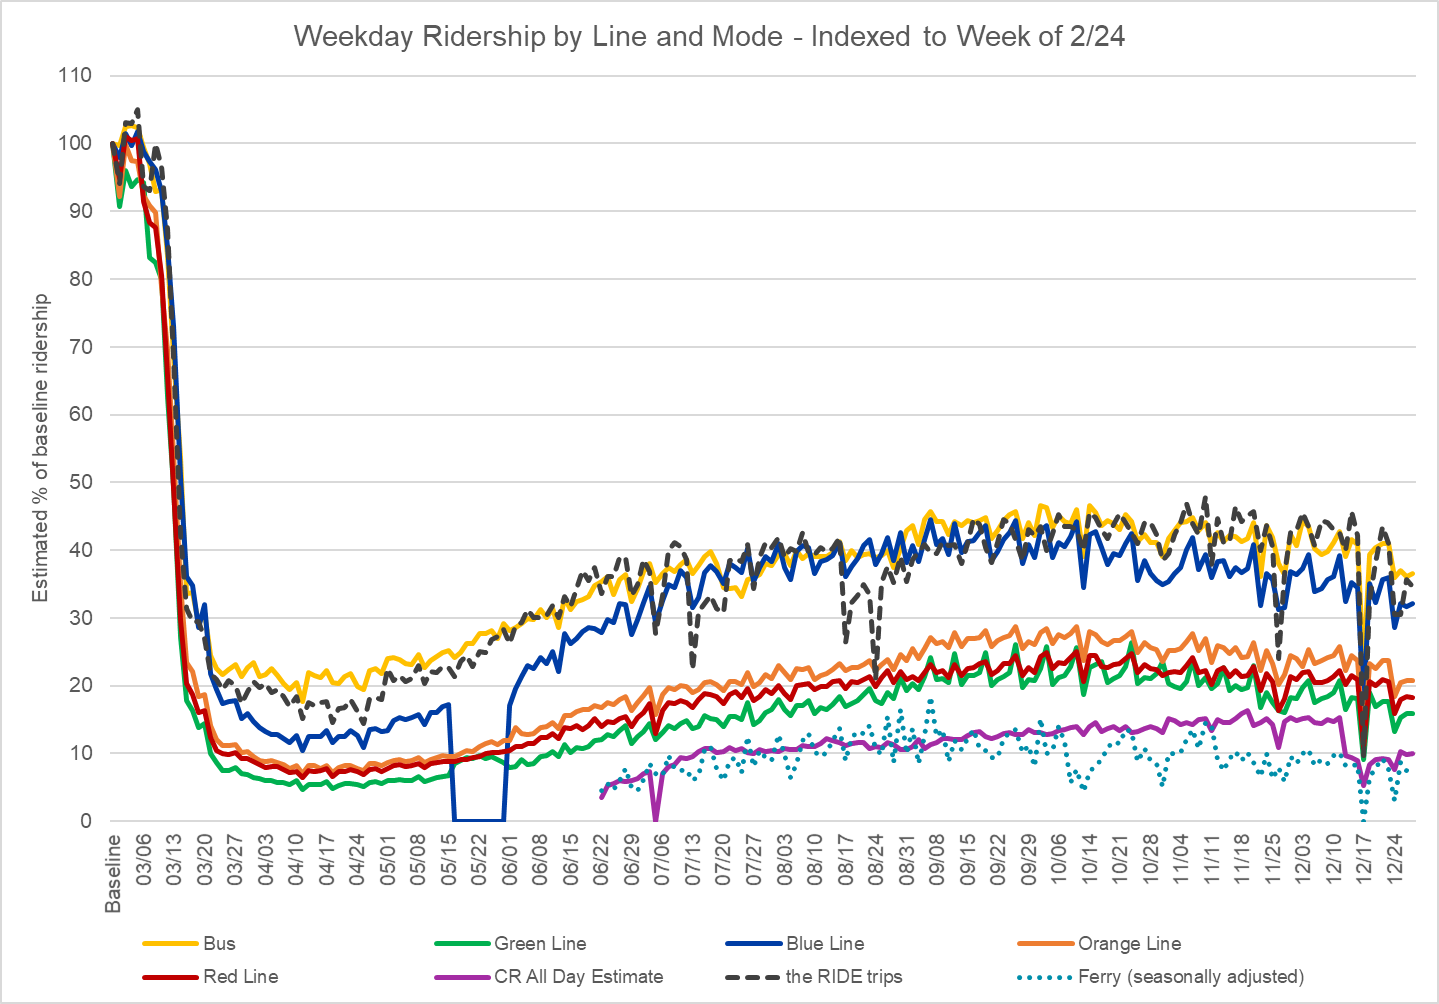
In the past two posts, we’ve given an overview of how ridership changed during the pandemic, both over the course of the year and spatially throughout the system. In this post, we’ll take a look at how patterns of ridership changed temporally on a weekly and daily level.
Ridership on the MBTA and public transit in general has dropped dramatically as a result of the COVID-19 pandemic. For this series of posts, we wanted to take a longer look at the year to review how ridership changed in three dimensions: by mode, over time, and by location.
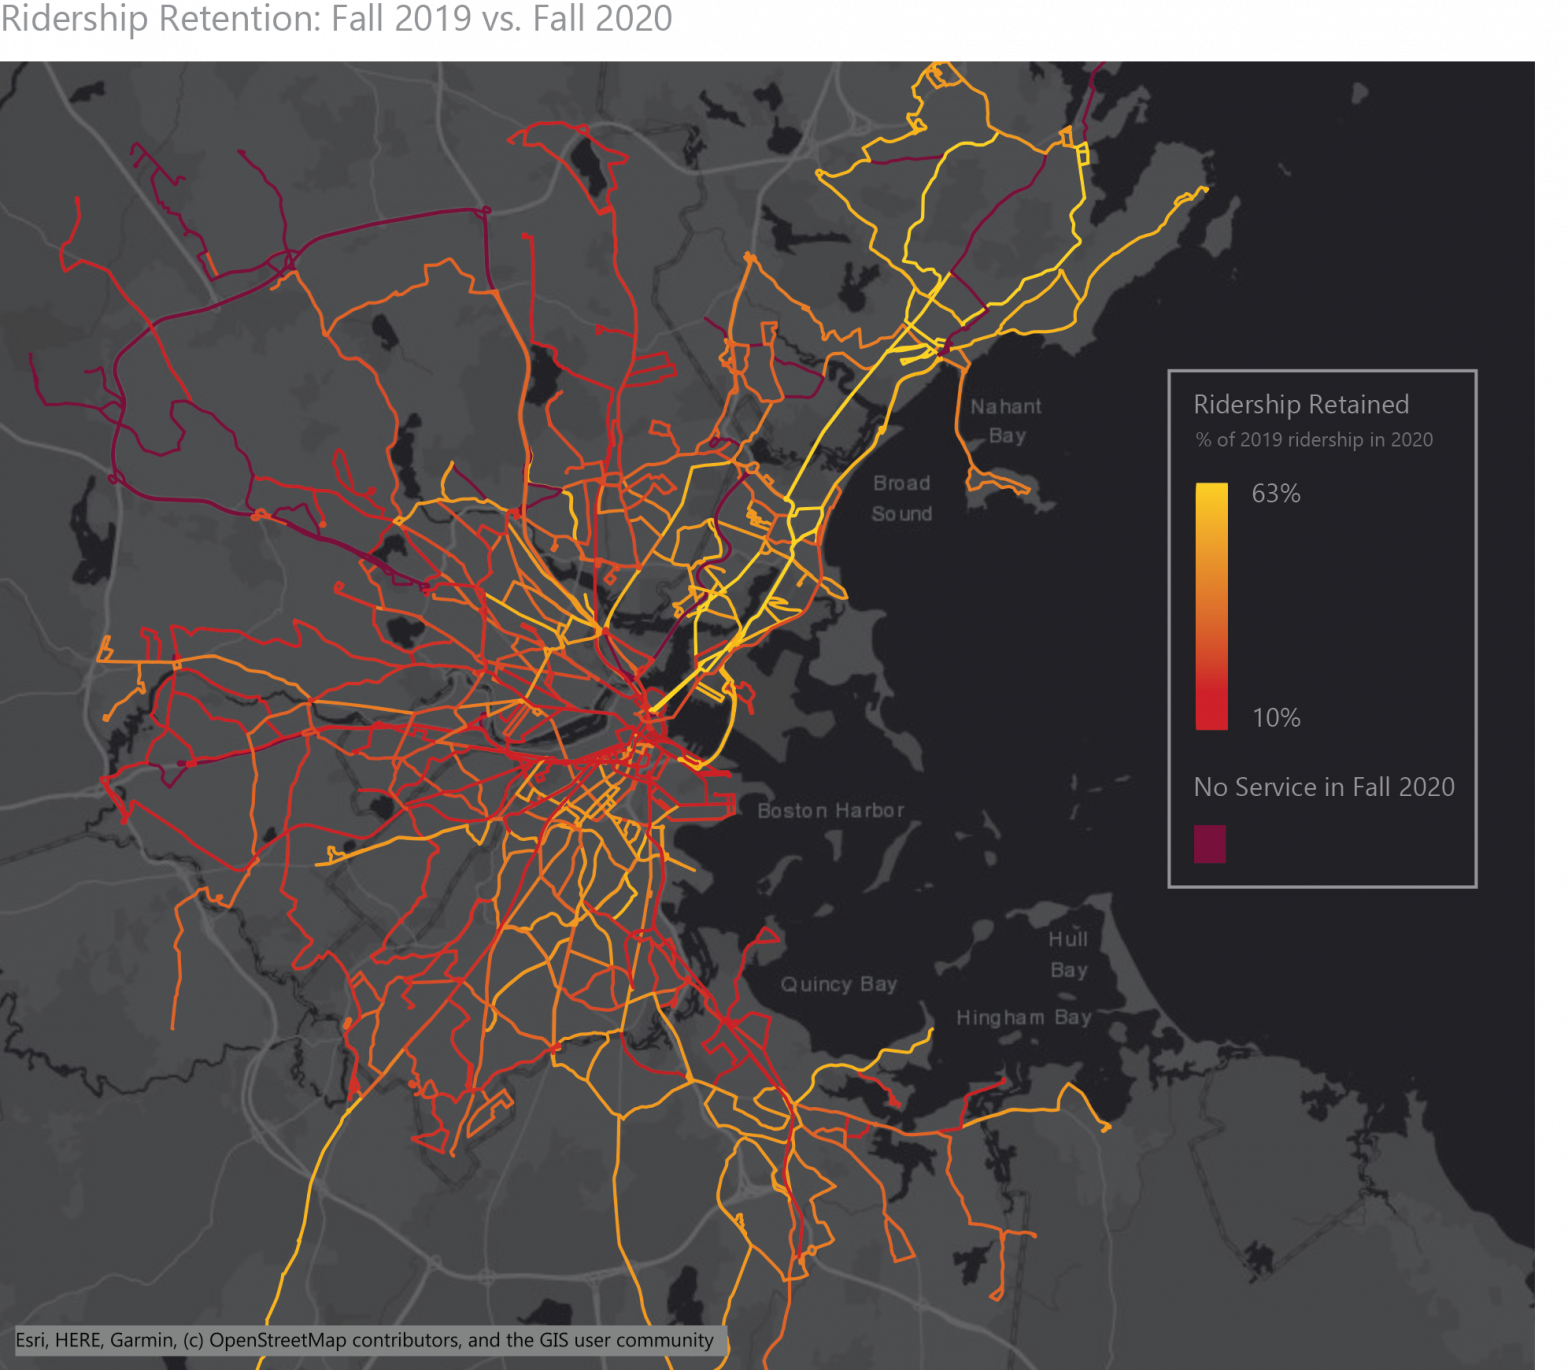
In 2020 Ridership In Review: Part 1, we took a broad look at ridership on the MBTA in 2020, and dove into the details on which types of passengers continued to ride the system. In this post, we’ll examine where passengers rode the system and how that changed from the patterns we typically see.
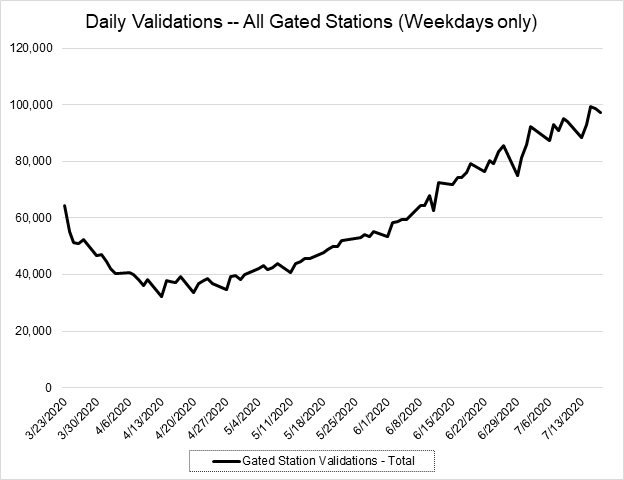
A summer 2020 update on ridership overall, with a particular focus on the work we are doing on the data and technology side to better capture bus ridership.
Mid-April 2020 update about ridership in the COVID-19 pandemic.
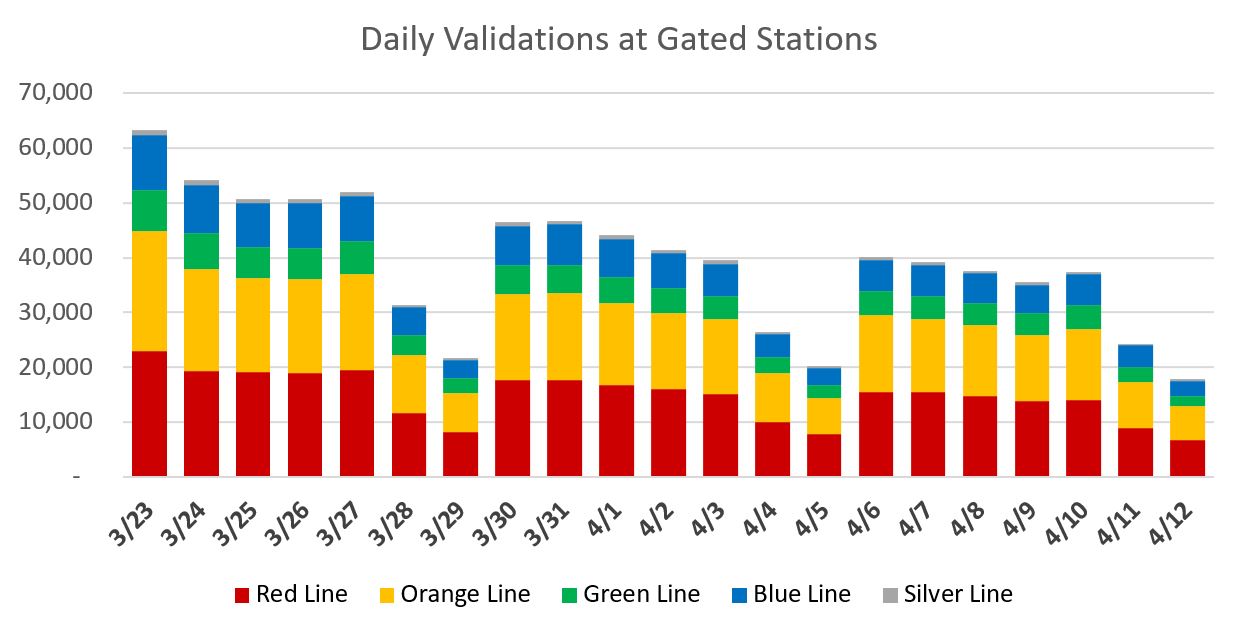
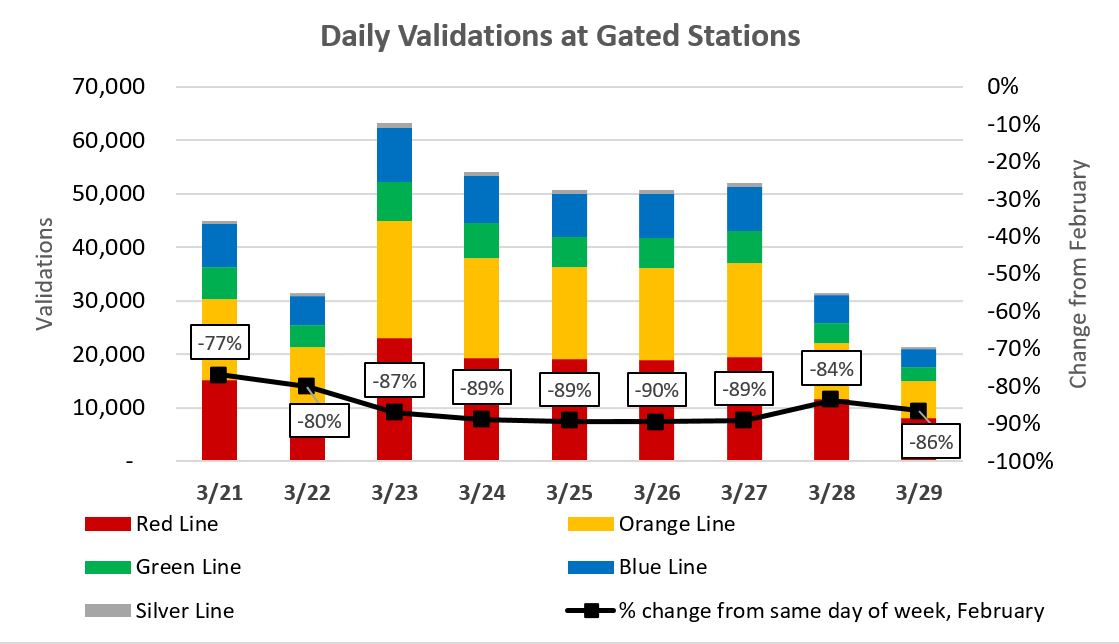
Early April 2020 update on the effect of the COVID-19 pandemic on MBTA ridership.
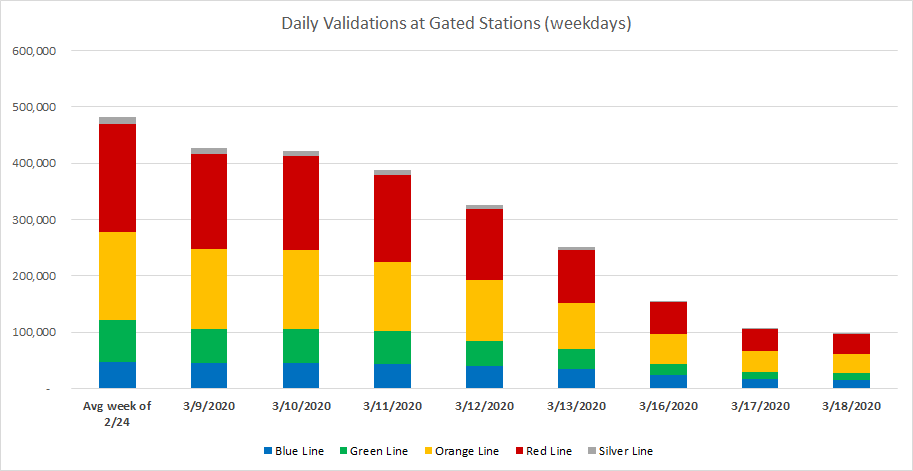
This post looks back at the week of 3/16/2020, when major changes in ridership due to the COVID-19 pandemic began to occur.
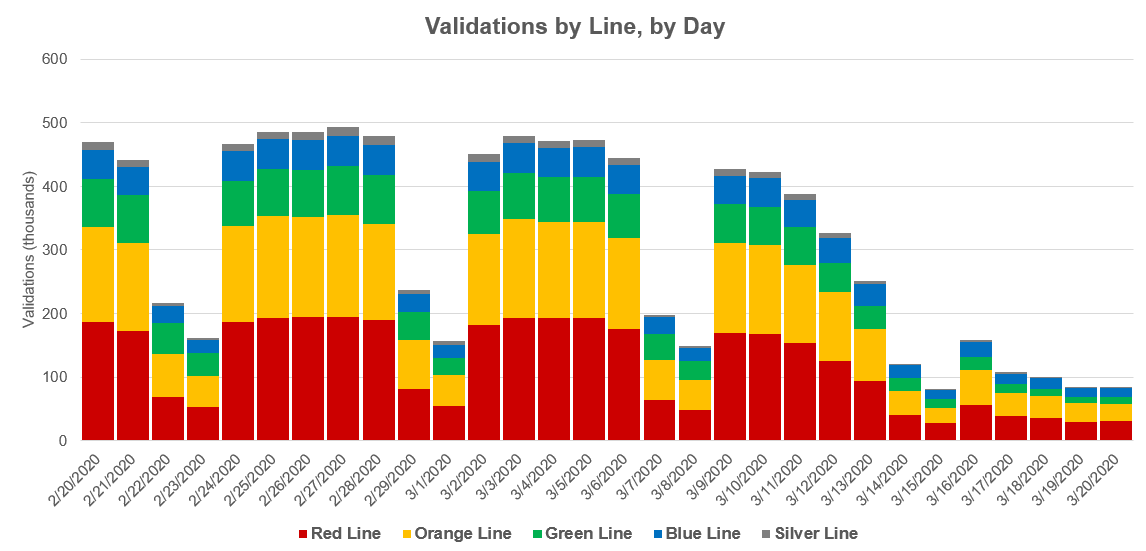
An early look at changed to ridership due to the COVID-19 pandemic, as of March 19, 2020.
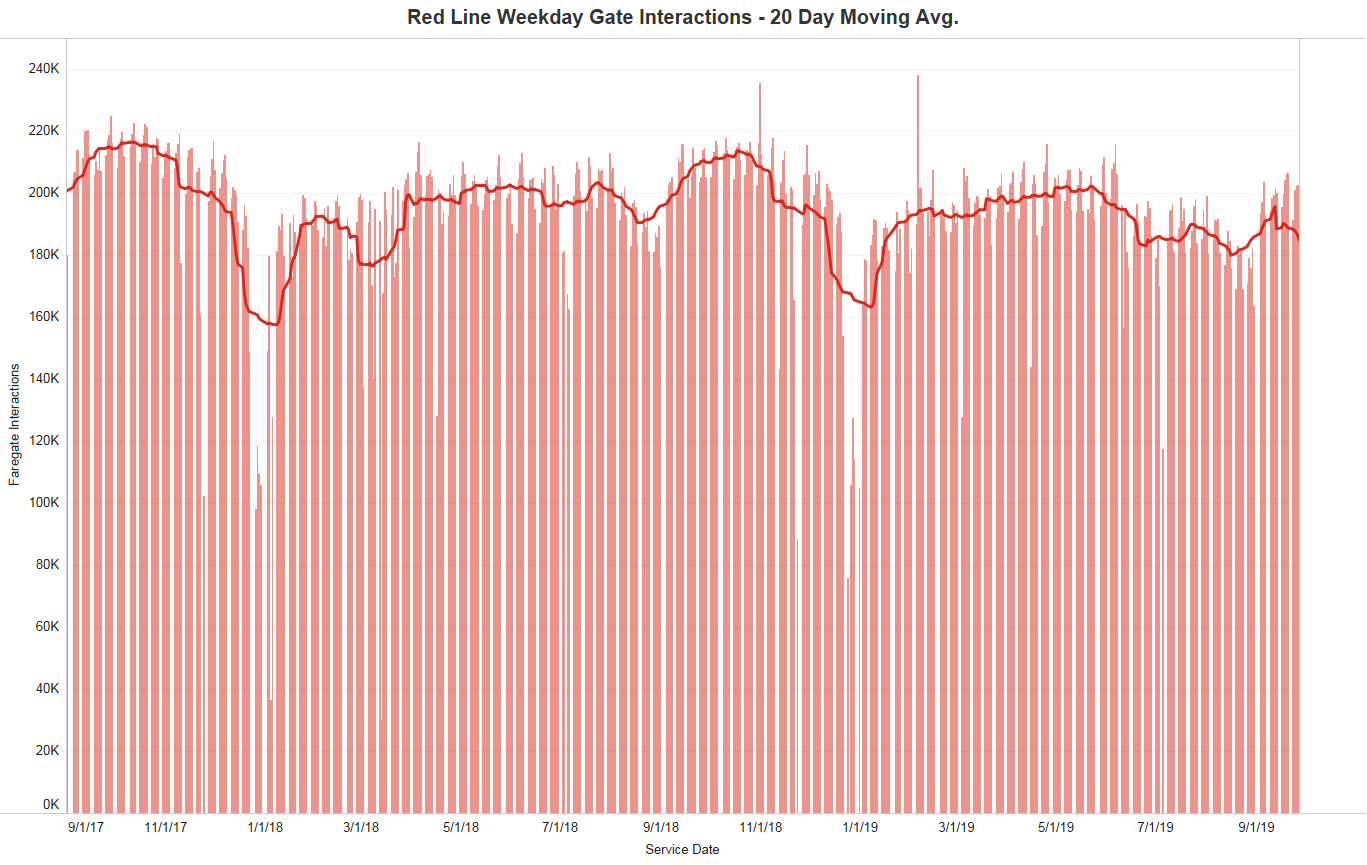
After the unfortunate derailment on the Red Line in June 2019 that drastically affected service throughout the summer, we visualized how ridership on the line had been impacted.
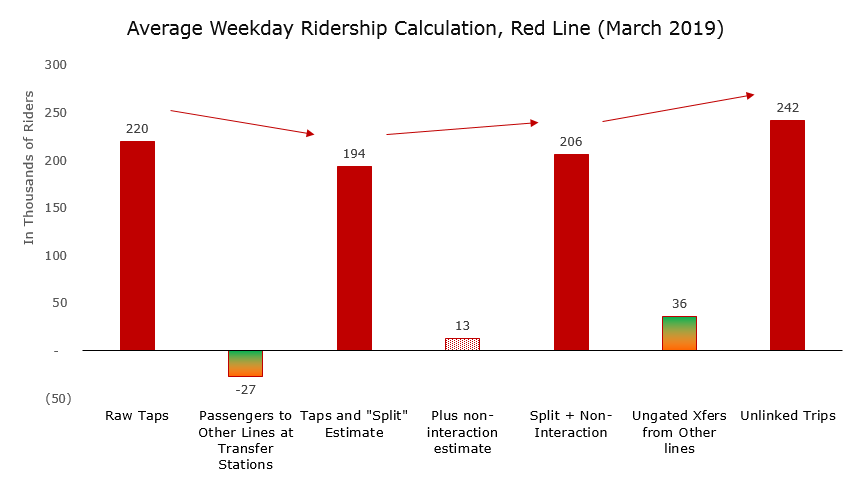
This post will discuss the methods we use to count riders and trips, and to estimate those we can't directly count. We will also discuss some of our future plans for improving these estimates and our reporting.